Your dashboard can pass design review, delight executives, and still fail accessibility in ways that create immediate business problems. That usually happens when the charting layer is treated as a front-end detail instead of a product requirement. The visual works. The data is accurate. But keyboard users can’t reach the controls, screen readers can’t interpret the chart, and the only way to understand values is to hover with a mouse.
For B2B teams, that failure isn’t minor. It affects ADA and Section 508 risk, procurement reviews, VPAT accuracy, and customer trust. It also slows releases because chart remediation almost always cuts across design, engineering, QA, analytics, and content teams.
Accessible charts need process, not patchwork. If your product includes dashboards, analytics widgets, investor reporting, healthcare metrics, fintech trend views, or downloadable reporting, your team needs a repeatable way to build and test data visualizations that work without sight, without a mouse, and without guessing.
Why Inaccessible Dashboards Create Business Risk
A common scenario looks like this. The team launches a polished analytics dashboard with interactive filters, trend lines, pie charts, and drilldowns. Then a customer, procurement reviewer, or internal accessibility lead tries to use it with a keyboard or screen reader and finds that the core data experience is inaccessible.
That failure creates more than usability friction. It can trigger ADA complaints, disrupt enterprise sales cycles, and force last-minute remediation work after launch. If your product supports reporting, analytics, or decision-making, inaccessible charts can block access to core functionality rather than a secondary feature.
For public-sector work and many enterprise deals, accessibility isn’t just a quality signal. It’s part of vendor review, contract language, and documentation. If your team publishes a VPAT or answers security and compliance questionnaires, inaccessible dashboards become a documentation problem as well as a code problem.
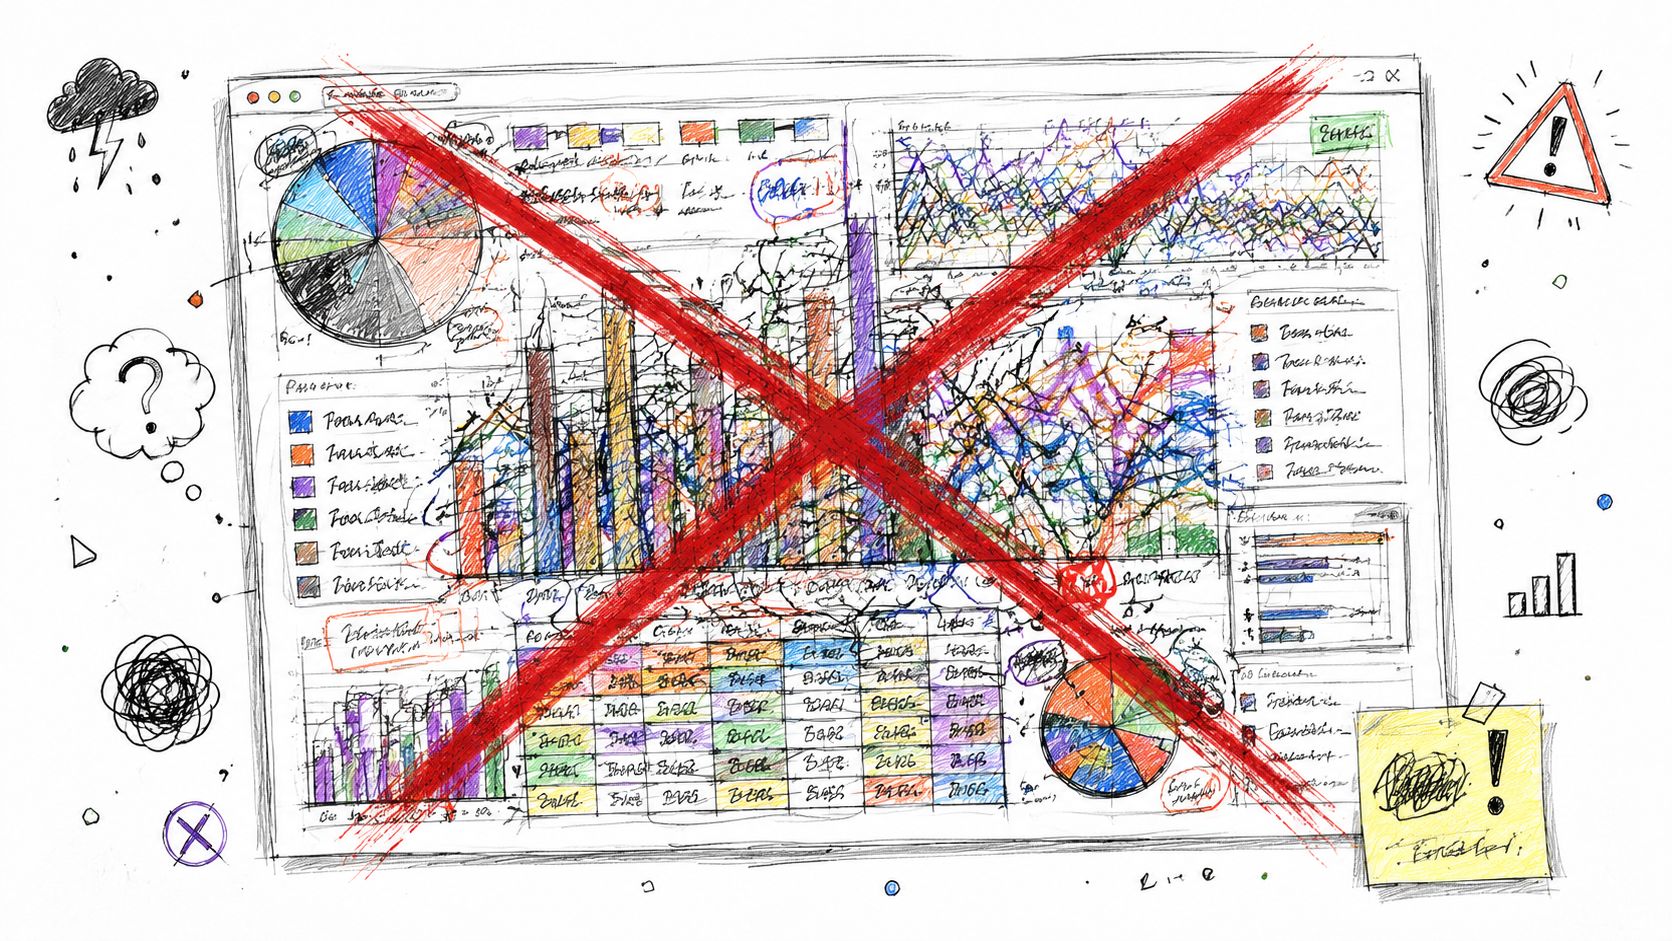
A visually strong dashboard can still be unusable.
Practical rule: If the only complete experience is the visual one, the dashboard isn’t accessible enough for compliance review.
Three business risks show up repeatedly:
- Legal exposure: If users can’t access the same information and workflows, the product may create ADA and related compliance risk. The financial side of that broader issue is outlined in this guide on the cost of ignoring WCAG compliance.
- Procurement friction: Government buyers, higher education, healthcare organizations, and large enterprises often ask how data visualizations behave with assistive technology.
- Operational drag: Chart fixes usually require updates to component libraries, QA scripts, design specs, and product documentation. Teams that wait until audit time end up paying for rushed remediation.
The main mistake is organizational. Teams often assign chart accessibility to a front-end developer near the end of the sprint. That rarely works. Accessible charts depend on content decisions, interaction design, component architecture, and testing discipline. If those pieces aren’t aligned early, the dashboard ships with hidden blockers.
The Principles of Accessible Data Visualization
WCAG is the baseline, not a design preference
Accessible charts sit inside the same compliance framework as the rest of your product. A foundational milestone is the Web Content Accessibility Guidelines, first published in 1999, with chart accessibility tied to text alternatives, contrast, and equivalent text or table formats, and operationalized in the U.K. Government Statistical Service checklist through chart titles, formal statistical titles, and accessible data downloads.
That matters because teams often treat dashboards as special. They aren’t. The same standards that govern forms, navigation, and media also apply to charts. If your chart is critical content, it needs to be perceivable, operable, understandable, and dependable.
For teams that work in heavily regulated industries, it helps to think of chart accessibility as part of your overall WCAG compliance services and remediation planning, not an isolated design task.
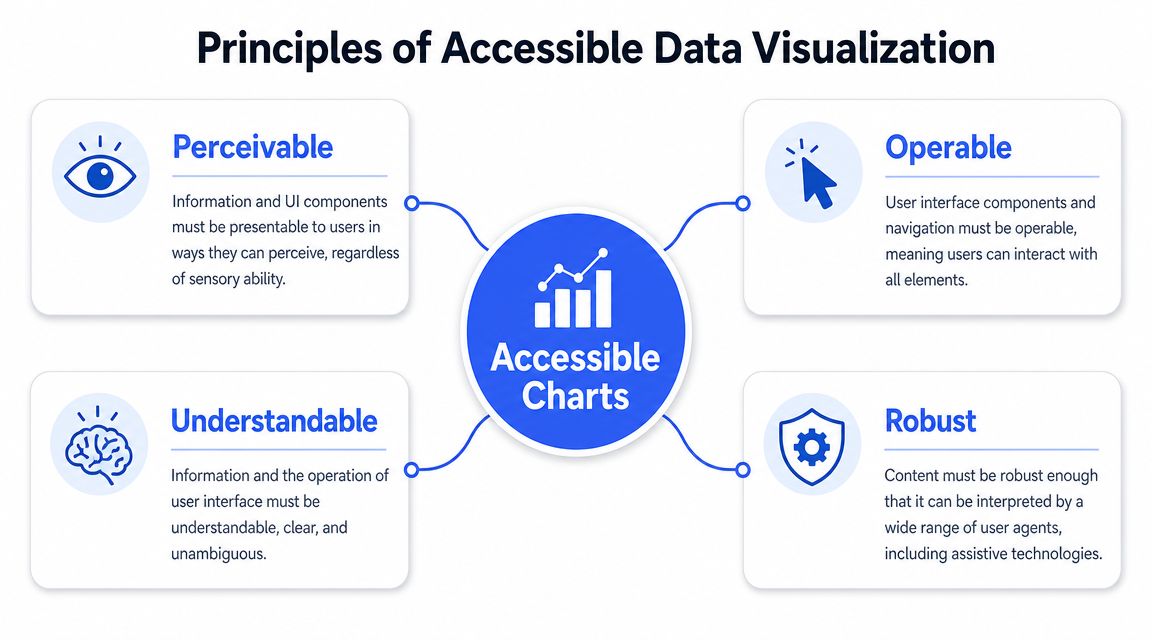
Translate POUR into chart requirements
The POUR model gives product teams a practical review lens:
| Principle | What it means for charts |
|---|---|
| Perceivable | Users need a text alternative, readable labels, sufficient contrast, and a non-color way to distinguish data. |
| Operable | Every filter, legend item, tab, drilldown, and data point interaction needs keyboard access. |
| Understandable | Labels, axes, state changes, and summaries need to make sense without visual inference. |
| Robust | The component has to expose usable semantics to assistive technologies across browsers and devices. |
A good dashboard doesn’t force users to reverse-engineer meaning from color and hover states. It gives them multiple paths to the same information.
That expectation shows up outside accessibility guidance too. Teams that care about strategic data visualization in banking already know that chart design affects decision quality. Accessibility pushes that thinking further by requiring charts to communicate clearly across different modes of use, not just to a sighted analyst using a mouse.
The most accessible chart is rarely the most visually compressed one.
Designers often try to fit everything into a single component. Accessibility usually improves when the chart is less dense, more directly labeled, and paired with structured supporting content. That doesn’t make the experience worse. It makes the data usable under real conditions.
Common Failures in Chart Accessibility
The failures that show up most often
Most inaccessible charts fail in familiar ways. The library may look modern, but the user experience breaks as soon as someone stops using a mouse.
The first failure is color-only meaning. If the product uses one color for one series and another color for a second series, but provides no direct labels, markers, line styles, or patterns, many users can’t reliably distinguish the data. Guidance on accessible charts notes that color alone is insufficient, recommends dual encoding, and requires chart text to meet at least 4.5:1 contrast against its background.
The second failure is hover-only disclosure. Teams put values in tooltips that only appear on mouse hover. Keyboard and screen reader users never get the same information. If the tooltip contains the actual value, trend explanation, or series detail, the chart is effectively incomplete for non-mouse users.
The third failure is image thinking. A chart gets exported as a static image with minimal alt text such as “sales dashboard” or “bar chart of quarterly results.” That label names the object but doesn’t communicate the underlying information.
Common audit issues include:
- Missing keyboard support: Users can’t tab into the chart, can’t move between data points, or lose focus after filtering.
- Weak focus indicators: Interactive controls exist, but the focus state is too subtle to track.
- No equivalent table or download: The chart has dense information, but there is no machine-readable fallback.
- Ambiguous labels: Axis labels, legends, and series names depend on visual positioning instead of clear text.
Why these issues survive normal QA
Standard QA often misses chart accessibility because most test cases confirm only visual rendering and data accuracy. If the graph loads and values match the API, the component gets approved.
That isn’t enough.
A chart can be functionally correct and still be inaccessible at every meaningful interaction point.
Charting libraries also contribute to the problem. Teams assume the library handles accessibility out of the box, then discover late that only some patterns are supported, or that custom configuration broke the default accessible behavior. Once product teams add custom legends, bespoke tooltips, canvas rendering, or animated transitions, the risk goes up fast.
Core Patterns for Building Accessible Charts
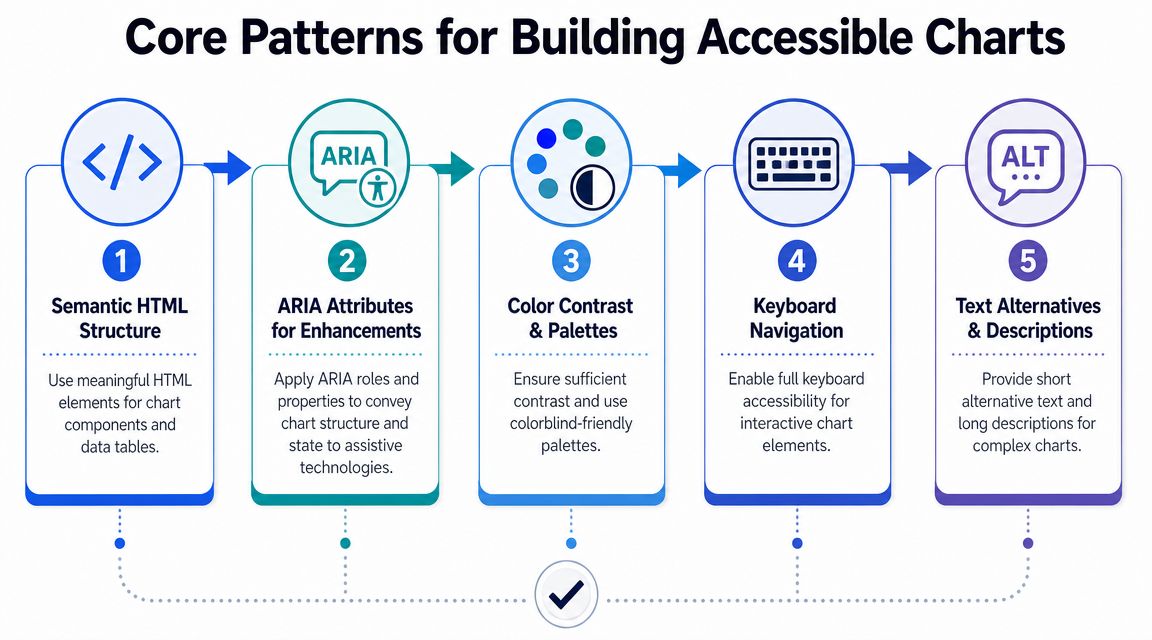
The strongest accessible charts use layered communication. They don’t rely on a single SVG or canvas object to do all the work. They combine a visual summary, a structured data representation, and a usable interaction model.
Start with an equivalent data layer
For many product teams, the most reliable fallback is a real HTML table tied to the same source data as the chart. That table doesn’t need to duplicate every visual styling choice. It needs to communicate the same information in a structured format.
A practical pattern looks like this:
<p class="figcaption">Quarterly revenue by region</p>


<div id="revenue-chart-summary">
Revenue rises across all regions, with the strongest values in the final quarter.
</div>


<div class="chart-component"><!-- SVG or chart library output --></div>

<table>
<caption>Quarterly revenue by region data table</caption>
<thead>
<tr>
<th scope="col">Quarter</th>
<th scope="col">North</th>
<th scope="col">South</th>
<th scope="col">West</th>
</tr>
</thead>
<tbody>
<tr>
<th scope="row">Q1</th>
<td>...</td>
<td>...</td>
<td>...</td>
</tr>
</tbody>
</table>
That table becomes even more important in dashboard ecosystems built on low-code and reporting platforms. Teams working through reporting and analytics rollouts often run into similar governance questions around controls, ownership, and extensibility. Broader platform decisions can shape accessibility outcomes, which is one reason product leaders evaluating Power Platform’s impact on business should also review how exported dashboards and embedded analytics components handle accessible output.
Write summaries that communicate meaning, not decoration
A chart summary shouldn’t narrate every pixel. It should explain what matters. Good summaries identify the subject, the comparison, and the takeaway. Weak summaries only say what kind of chart it is.
A better summary pattern:
- Name the data: What is being measured?
- Set the frame: Over what categories, geography, or time period?
- State the key signal: Increase, decrease, concentration, outlier, ranking, or comparison.
- Point to the full data: Link the table, CSV, or accessible download.
Teams usually write these summaries badly because no one owns the content. Product managers know the business meaning, analysts know the data, and developers own the component. Someone has to close that gap. If your team struggles with concise, informative summaries, the same writing discipline used for accessible content writing applies here.
A short demo can help teams visualize the implementation patterns in practice.
Use ARIA carefully in interactive charts
Interactive charts need more than labels. They need a full non-visual interaction model. Guidance on accessible charts explains that keyboard users should reach every control and data point, commonly with Tab and Arrow keys, while screen readers need enough context to announce series, category, and value, especially because SVG and canvas elements are often invisible to assistive technology unless semantics and focus order are added explicitly.
That often means:
- Expose grouped navigation: Let users tab to the chart region, then use arrow keys within the data series.
- Announce state changes: If a filter updates the chart, notify screen reader users that the view changed.
- Preserve focus: After sorting, filtering, or drilldown, don’t dump focus back to the top of the page.
- Avoid ARIA overload: Don’t assign roles and labels blindly to every shape if the result becomes noisy and unusable.
Pseudo-code for a focusable point might look like this:
<button
class="chart-point"
aria-label="North region, Q2, value 42"
>
<!-- visual point -->
</button>
That pattern isn’t always elegant in the DOM, but it gives assistive tech something real to interact with. Accessibility often requires that kind of engineering trade-off.
Advanced Techniques for SVG and Canvas
SVG can be made accessible, but only if you structure it
SVG gives you more control than canvas because it exists in the DOM. That makes it a better starting point for accessible charts, but only when teams use that control intentionally.
At minimum, the SVG needs a meaningful accessible name and description. If the chart is treated as a single image-like object, the name and description should summarize what the chart communicates. If individual data points are interactive, those elements need focus management and meaningful labels of their own.
A simplified pattern looks like this:
<svg role="img" aria-labelledby="chart-title chart-desc" tabindex="0">
<title id="chart-title">Quarterly revenue by region</title>
<desc id="chart-desc">Line chart showing upward movement across all regions.</desc>
<!-- chart shapes -->
</svg>
If you’re working through SVG semantics in more depth, this guide to the SVG img role and text alternatives is useful for implementation details.
Interactive SVG charts add another layer. Focus order has to match the mental model of the chart. If users move through bars, points, or segments in a confusing sequence, the chart becomes technically reachable but practically unusable. Custom legends, toggles, and tooltips also need to participate in the same interaction pattern.
Canvas needs a parallel accessibility model
Canvas is harder because assistive technology doesn’t get the internal drawing model. It gets a bitmap unless you build something else for it.
That means a canvas chart usually needs a parallel DOM representation. In practice, teams create one of these patterns:
| Rendering choice | Accessibility approach |
|---|---|
| Static canvas chart | Provide a nearby text summary and a full HTML table or downloadable dataset. |
| Interactive canvas chart | Build synchronized DOM controls and data point representations that mirror the visual state. |
| Complex multi-series chart | Reduce chart density and provide separate tables or segmented views for different data slices. |
Teams often discover that one chart is trying to do too much. Harvard’s guidance on data visualizations recommends alternate formats, keyboard-navigable data points, and, for complex graphs such as stacked bars, multiple simpler tables to improve navigation and machine-readable access.
If a chart needs visual compression to fit on screen, it often needs structural expansion to be accessible.
For senior engineers, the primary decision isn’t SVG versus canvas in the abstract. It’s whether the chosen rendering model supports an accessible architecture without excessive custom remediation. If it doesn’t, the cheaper library choice can become the more expensive accessibility choice.
How to Test Charts for Accessibility
Use automated tools first, but don’t stop there
Automated scanners are useful for catching obvious issues around naming, structure, and some contrast failures. They can also flag missing form labels in chart filters or detect focus problems in surrounding controls. But they won’t tell you whether a user can understand a complex visualization.
That matters because charts often fail in ways scanners can’t evaluate. A tool won’t reliably judge whether a summary is meaningful, whether keyboard navigation order makes sense, or whether a screen reader announcement gives enough context to interpret a point.
Teams should still run automation early. It saves time. But chart testing needs a layered process, and the limits of scanners are exactly why manual vs automated accessibility testing matters so much for dashboard work.
Manual testing is where chart issues surface
A workable chart QA routine includes several passes by different roles.
Start with keyboard-only testing. Can you reach every filter, toggle, legend item, and drilldown? Can you move through the chart in a predictable way? Does focus stay visible and stable after updates?
Then run screen reader testing with products your customers use, such as NVDA, JAWS, and VoiceOver. Listen for whether the experience answers basic questions: What am I on? What data point is selected? What changed after I applied a filter? Is there a way to get the underlying data?
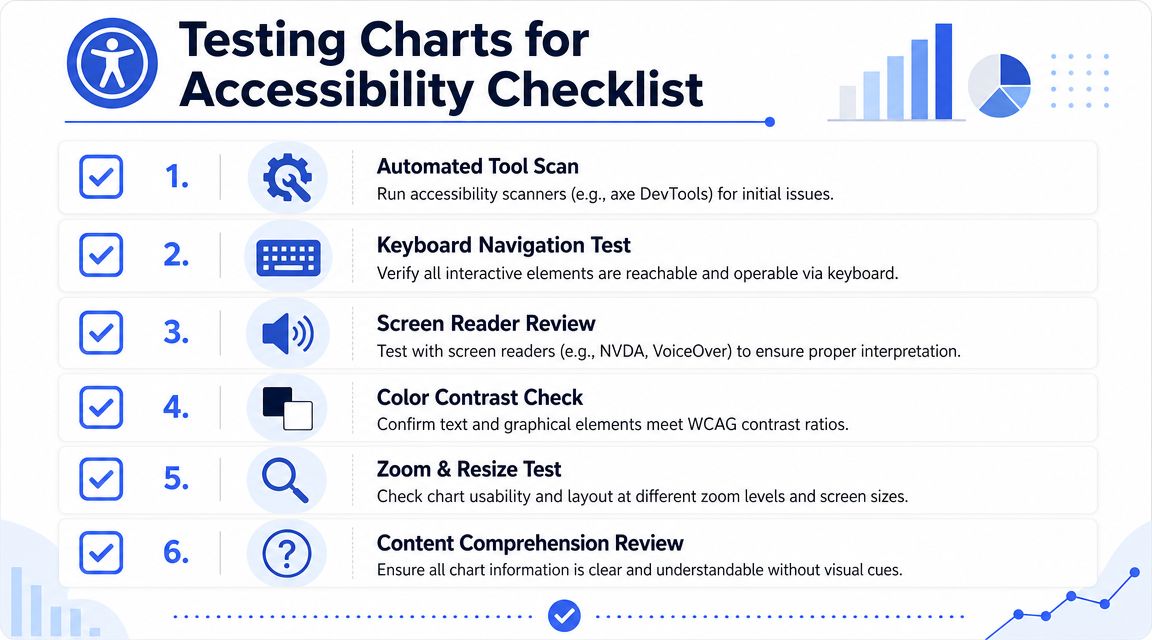
Use a short checklist:
- Check entry and exit: Users should be able to enter the chart region and leave it without getting trapped.
- Verify announcements: Each interactive point should expose enough context to stand on its own.
- Review equivalent access: Confirm the data table, download, or summary covers the same information as the visual.
- Test responsive behavior: Zoom, resize, and reflow can break legends, labels, and focus order.
- Validate content clarity: If a non-visual user hears the output once, it should still make sense.
Accessibility testing for charts is less about finding one defect and more about confirming an entire interaction model.
Product teams usually learn whether they built an accessible chart or only an accessible-looking chart.
Remediation Checklist for Product Teams
What to fix before the next release
If your current dashboard has accessibility debt, start with the items that affect access to core information.
- Add an equivalent data representation: Provide a real HTML table, accessible spreadsheet, or other machine-readable format when the chart contains substantive data.
- Remove hover-only dependency: Make sure values and status changes are available without a mouse.
- Review color usage: Use labels, markers, line styles, or patterns so color isn’t the only differentiator.
- Check keyboard behavior: Every control and data point interaction needs a usable focus order.
- Improve summaries and labels: Name the dataset clearly and explain the main takeaway in plain language.
- Retest after each change: Chart remediation can easily fix one issue while breaking focus, announcements, or layout elsewhere.
When to bring in a formal audit
Some issues need judgment rather than a one-line fix. A recurring challenge in making charts accessible is the tradeoff between keeping charts simple enough to be accessible and complex enough to remain useful, with guidance often leaving open when a chart should become small multiples, a table, or a downloadable dataset.
That judgment affects compliance documentation. It also affects your VPAT, release decisions, and remediation roadmap. If your product relies on dashboards for core workflows, a formal accessibility audit is usually the safer path. It gives teams validated findings, code-level recommendations, and documentation they can defend in procurement and legal review.
If your team needs help auditing or remediating accessible charts, ADA Compliance Pros provides manual accessibility testing, WCAG-mapped findings, remediation guidance, and procurement-ready documentation for websites, web apps, dashboards, and ICT products.