
Score your accessibility program on the federal maturity scale
You have been handed accessibility and told to assess where the organization stands and come back with a plan. Whatever triggered it (a customer’s accessibility questionnaire, a procurement officer asking for an ACR, a demand letter, a public-sector or healthcare customer with a 2027 date on their side of the contract, a redesign that broke something visible), two problems arrive together.
You have to pick an assessment instrument you can defend to people who will ask where it came from, and you have to convert its output into a budget request for a program that currently has no owner, no line item and no baseline. A maturity level on its own does neither. It puts you on a rung with no distribution behind it, so nobody in the room can say whether that rung is normal, good or alarming. Even the model published by W3C, the Accessibility Maturity Model Group Note, reports no assessment results for any organization at all.
There is a published scoring instrument that fixes both problems. It comes from the federal government, it is statutory, its arithmetic is published in full, and so are the scored results for 60 named agencies. The headline is the part that will do the work in your budget meeting: federal agencies, reporting on themselves to Congress under a statutory mandate, score 2.00 out of 5 on testing and remediation and 1.96 out of 5 on accessibility conformance.
What the instrument actually is
The FY 2025 Governmentwide Section 508 Assessment is a statutory report, not a voluntary benchmark or a vendor framework. GSA states the mandate directly: it submits the assessment “as mandated by Public Law No. 117-328 (codified at 29 U.S.C. § 794d-1),” prepared “in consultation with the Office of Management and Budget (OMB) and the U.S. Access Board,” and addressed to the Senate Committees on Appropriations and Homeland Security and Governmental Affairs and the House Committees on Appropriations and Oversight and Government Reform. Public Law 117-328 is the Consolidated Appropriations Act, 2023, which the Access Board describes as having “directed GSA, OMB, and the Access Board to work together to collect and evaluate federal agency data on information and communication technology (ICT) accessibility.” The recurring duty sits at 29 U.S.C. § 794d-1(b), which GSA reads as “a statutory requirement to provide an annual comprehensive assessment of Section 508 compliance across the federal government.”
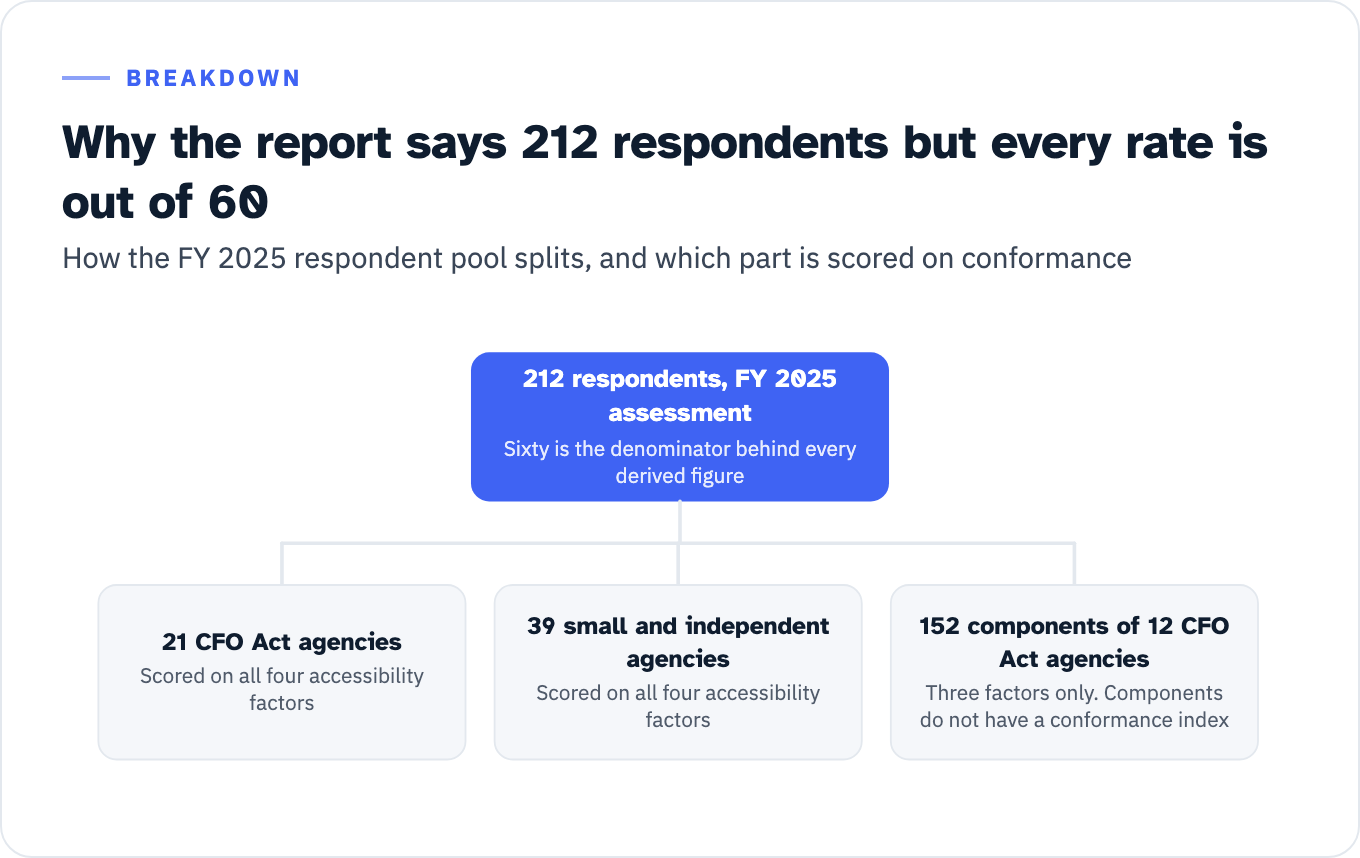
It was submitted to Congress and published on 2 March 2026, and the Access Board announced it three days later, on 5 March 2026. It is the third annual edition. It covers 212 respondents: “21 Chief Financial Officers (CFO) Act agencies, 152 components from 12 CFO Act agencies, and 39 small and independent agencies.” All 212 are named in the published response files. The 21 and the 39 are the 60 agencies scored on all four factors; components are scored on three, because, as GSA’s methods appendix puts it, “Components do not have a conformance index.” Sixty is the denominator behind every derived figure below.
View the data as a list
212 respondents, FY 2025 assessment: Sixty is the denominator behind every derived figure
- 21 CFO Act agencies: Scored on all four accessibility factors
- 39 small and independent agencies: Scored on all four accessibility factors
- 152 components of 12 CFO Act agencies: Three factors only. Components do not have a conformance index
One terminology point before going further, because the search term that brought you here is misleading. GSA does not call this a maturity model and it is not one. The word maturity appears three times in the whole report, always incidentally and never as the name of anything, and the phrase “maturity model” does not appear at all. What GSA publishes is an annual compliance assessment that produces four “accessibility factor outcomes” on a 5-point scale, grouped into two evaluation indices with five named performance bands. That distinction is worth holding onto, because it is exactly why the instrument is more useful than the maturity models. A maturity model tells you what good looks like. This tells you what everybody else scored.
The benchmark
Four factors, four published governmentwide averages.
| Accessibility factor | Governmentwide average (0 to 5) | Band | Index |
|---|---|---|---|
| Policy Integration | 3.04 | High | Implementation (i-index) |
| ICT Acquisition and Procurement | 3.44 | High | Implementation (i-index) |
| Testing and Remediation | 2.00 | Low | Implementation (i-index) |
| Accessibility Conformance | 1.96 | Low | Conformance (c-index) |
The bands are published too, which is what lets a self-assessment score convert into the same performance category GSA uses rather than into a number you have to interpret on your own.
| Score range | Performance category |
|---|---|
| 0 to 1 | Very Low |
| Above 1 to 2 | Low |
| Above 2 to 3 | Moderate |
| Above 3 to 4 | High |
| Above 4 to 5 | Very High |
The shape of that first table is the argument. Federal agencies score High on writing policy and High on buying, and Low on testing what they built and Low on whether the result conforms. GSA says plainly what is causing it: “Testing and Remediation is the weakest accessibility implementation area, with agencies reporting an average outcome of 2.00 (Low), reflecting limited standardization, inconsistent execution, and weak governance controls.”
The spread is wide enough that a mid-range score means something. Implementation outcomes ran from 0.66 to 4.84, and conformance from 0 to 4.94. Computed from GSA’s published FY 2025 agency response file, 35 of the 60 reporting agencies landed in the bottom two conformance bands (17 Very Low, 18 Low), and 37 landed in the bottom two Testing and Remediation bands (19 Very Low, 18 Low).
Four caveats to state out loud before you paste this into a deck
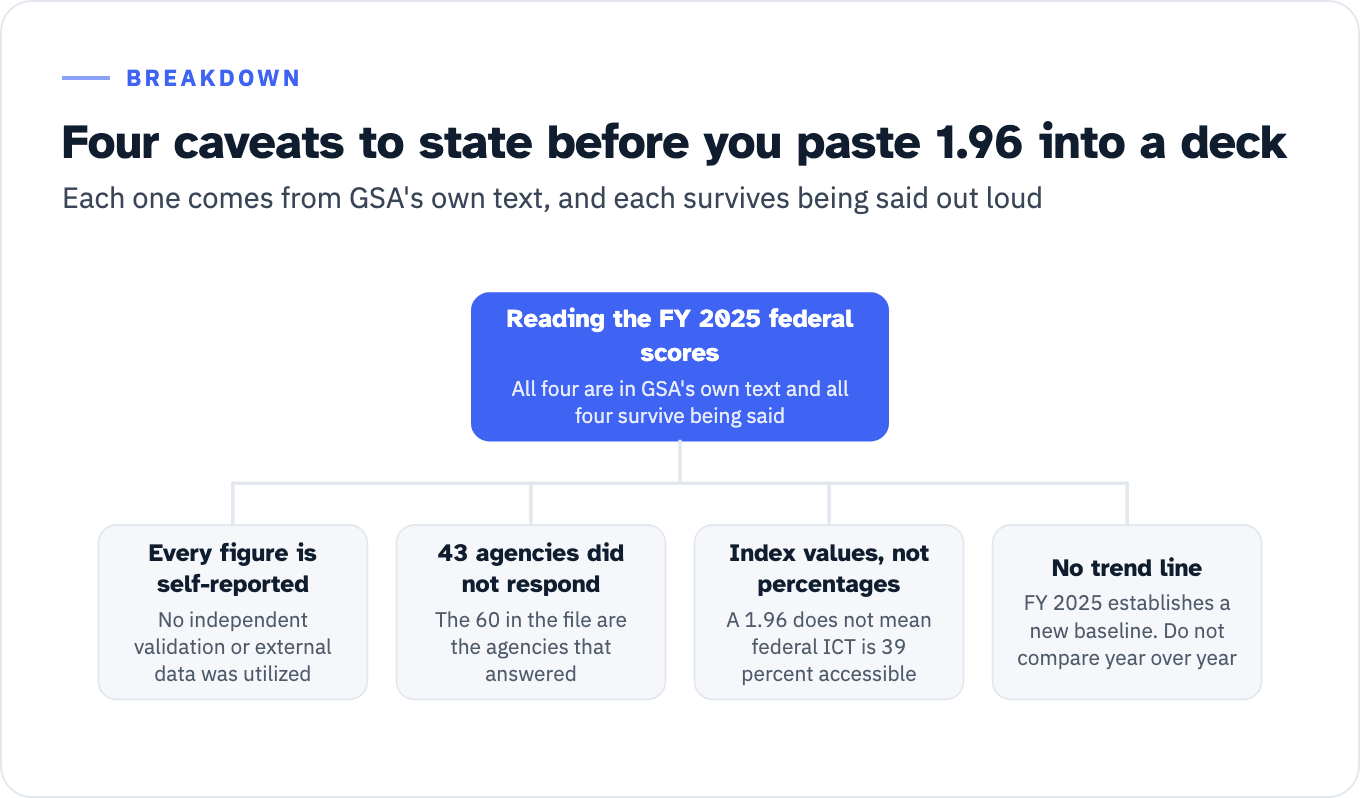
Say these before someone else finds them. All four are in GSA’s own text and all four survive being said.
Every figure is self-reported. GSA’s methods appendix is unambiguous: “Agencies, parent agencies, and components self-reported the data in this report. No independent validation or external data was utilized.” That cuts in favor of the argument rather than against it. A self-reported 1.96 is the government grading its own homework and still landing in GSA’s own Low band.
The respondent pool is not the whole government. GSA states that “Forty-three agencies failed to respond to the FY 2025 assessment and more than half of responding agencies cited resource limitations.” The 60 in the file are the agencies that answered.
The factor outcomes are index values, not percentages. They are a rescaled 0-to-5 composite of weighted question scores. A 1.96 does not mean federal ICT is 39 percent accessible, and no factor outcome converts into a percentage of anything. A separate set of percentages describes conformance of top-viewed content, and the two must never be mixed.
There is no trend line. GSA revised the criteria, the respondent pool changed, and the report says “FY 2025 establishes a new baseline for ICT accessibility throughout the federal government” and instructs that “readers should avoid comparing year-over-year conformance percentages.” Treat it as a standing baseline. For a self-assessment, a standing baseline is the useful kind.
View the data as a list
Reading the FY 2025 federal scores: All four are in GSA’s own text and all four survive being said
- Every figure is self-reported: No independent validation or external data was utilized
- 43 agencies did not respond: The 60 in the file are the agencies that answered
- Index values, not percentages: A 1.96 does not mean federal ICT is 39 percent accessible
- No trend line: FY 2025 establishes a new baseline. Do not compare year over year
Why this instrument rather than the maturity models
The nearest thing to a standards-body alternative is the W3C Accessibility Maturity Model, a W3C Group Note published 4 November 2025. It has seven dimensions (Communications; ICT Development Lifecycle; Knowledge and Skills; Oversight and Culture; Personnel; Procurement; Support) and four cumulative levels: Inactive, “Little to no awareness, activity, or recognition, of need”; Launch, “Recognized need in the organization. Planning initiated, but activities not well organized”; Integrate, “Roadmap in place, overall organizational approach defined and well organized”; and Optimize, “Incorporated into the whole organization, consistently evaluated, and actions taken on assessment outcomes.”
It is a genuinely useful document for working out what proof points to collect. It is not a W3C standard, and if you present it to a governance committee as though it were, expect to be corrected. Its own status section says it “is endorsed by the Accessible Platform Architectures Working Group, but is not endorsed by W3C itself nor its Members.” It is not a Recommendation, it has no conformance requirements and no success criteria, its proof points are “non-exhaustive examples of criteria,” and its assessment spreadsheet carries an editor’s note reading “This Assessment Spreadsheet is experimental and is a work in progress.” Assessment against it is qualitative, which means it will not produce a number you can defend the arithmetic of, and the Note publishes no organization’s results to compare yours against.
Provenance varies across the rest of the category, so check who wrote the one you are about to put in front of a governance board. Some are public-sector work. The Accessibility Capability Maturity Model is not a vendor product: the California Community Colleges Accessibility Center developed it, and the page states that “The California Community Colleges Chancellor’s Office has formally recognized the Accessibility Capability Maturity Model (ACMM) as a critical framework for institutional compliance and risk mitigation.” It is built for a specific sector, “colleges and districts” in one state’s community college system, and participation requires “executive support (Vice President level or higher).” Others are vendor instruments, the Digital Accessibility Maturity Model from Level Access among them. A vendor-authored scale is not automatically a bad scale, but being measured against a scale written by a firm that sells remediation is an objection somebody will raise the moment you ask for money.
The GSA scale answers the provenance objection by publishing everything: the question bank, the weights, the answer ladder, the per-agency results and the underlying response files, released as an open government data asset. Anyone in the room can check your arithmetic against the same source you used.
Use both if you want. The W3C model is a decent list of the evidence to gather. The GSA scale tells you what the result is worth on a scale somebody else has already been measured on.
View the data as a table
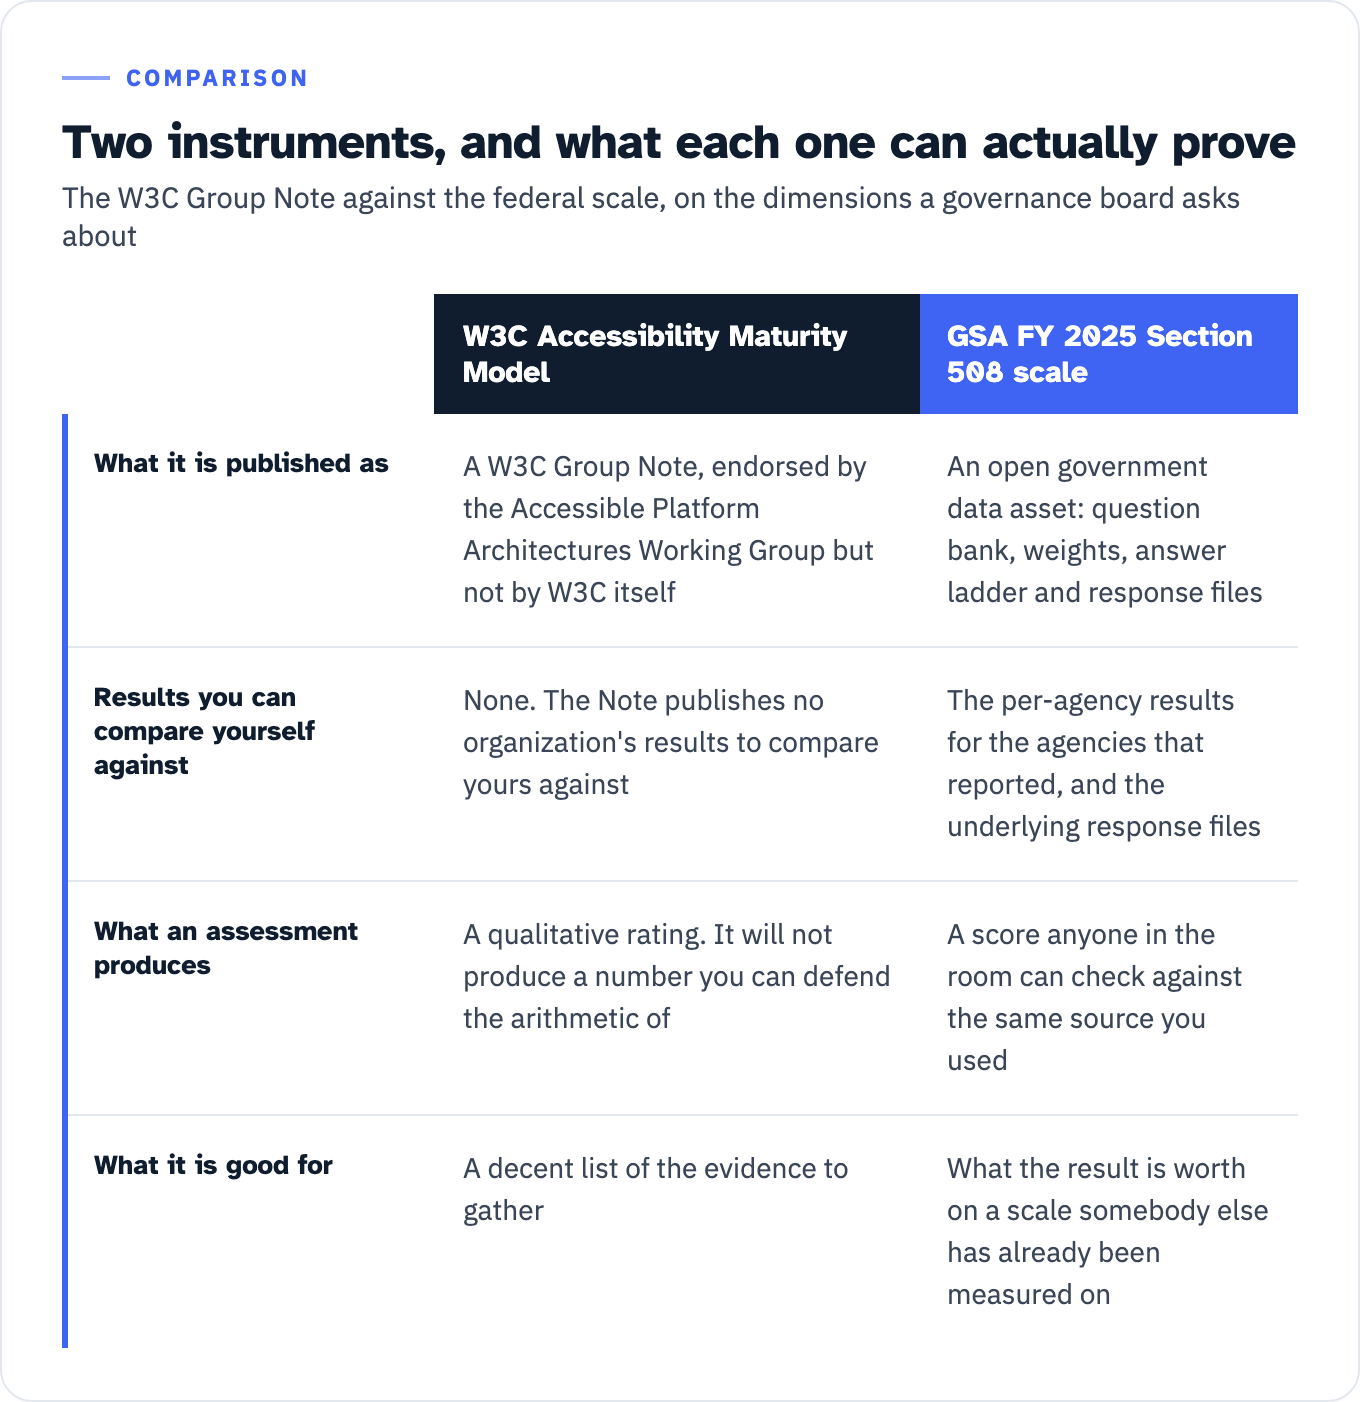
| W3C Accessibility Maturity Model | GSA FY 2025 Section 508 scale | |
|---|---|---|
| What it is published as | A W3C Group Note, endorsed by the Accessible Platform Architectures Working Group but not by W3C itself | An open government data asset: question bank, weights, answer ladder and response files |
| Results you can compare yourself against | None. The Note publishes no organization’s results to compare yours against | The per-agency results for the agencies that reported, and the underlying response files |
| What an assessment produces | A qualitative rating. It will not produce a number you can defend the arithmetic of | A score anyone in the room can check against the same source you used |
| What it is good for | A decent list of the evidence to gather | What the result is worth on a scale somebody else has already been measured on |
The arithmetic, which is the part nobody else publishes
GSA scores every criterion on a fixed 0-to-4 ladder:
a) = 0; signifying never, no, or not integrated / b) = 1; signifying rarely or somewhat integrated / c) = 2; signifying sometimes or moderately integrated / d) = 3; signifying often or mostly integrated / e) = 4; signifying almost always, yes, or fully integrated
Yes answers score 4, No answers score 0. A Not Applicable answer also scores 4, and GSA explains why: “We chose to do this so all agencies had an equal number of questions to evaluate and no one was penalized with a low value for activities or ICT that do not apply to them.” Note the consequence when you score yourself. A high score achieved partly through N/A answers is not evidence of broad coverage, so record which rows you marked N/A and be ready to say so.
The weights are equal within each factor and published:
| Factor | Questions | Weight |
|---|---|---|
| Policy Integration | Q15a to Q15i, nine business functions | 11.11% each |
| ICT Acquisition and Procurement | Q22 to Q27, six acquisition steps | 16.66% each |
| Testing and Remediation | Five per-ICT-type sets: Q29a to Q29f, Q30a to Q30f, Q31a to Q31g, Q32a to Q32g, Q33a to Q33g | 20% per set, all responses within a set equally weighted |
Two of those five testing sets have six questions and three have seven, which is not a typo and matters when you score yourself. Because weighting is equal within a set, each hardware answer carries a sixth of hardware’s 20 percent and each public web page answer carries a seventh of that ICT type’s 20 percent. Score hardware against seven questions and your number stops being comparable to 2.00.
In GSA’s words, “each of the three factor areas was summed and weighted equally to create the i-index,” and “each index was then scaled to a 5-point scale.” Accessibility Conformance sits outside the implementation index as its own c-index, built from nine equally weighted sets at 11.11 percent each: the five per-ICT-type conformance sets (tracking mechanism, number tested, number fully conformant) plus four top-viewed sets for public web pages, intranet web pages, public electronic documents and videos.
Keeping conformance out of the implementation index matters more than it looks. You can answer the three implementation factors honestly from documents and interviews in an afternoon. You cannot answer the conformance factor that way, because it is built from actual test results on actual ICT. And an organization that has never tested anything does not escape the question. GSA scores non-testers, and it scores them zero: “if an agency reported ‘No,’ they did not have a tracking mechanism for ICT listed in Q29i, Q30i, Q31h, Q32h, or Q33h, they were assigned a ‘0’ for that ICT,” and “If an agency did not include any results for Top-Viewed ICT despite having that ICT, they were assigned a ‘0.’” In the report’s own words, “some agencies received an outcome of zero after reporting that they lacked the resources to conduct accessibility testing.” Zero sits in the Very Low band. Under GSA’s rules, never having tested is not a missing score, it is the worst available one, and that is how a customer will read it.
The worksheet
Below are the three implementation factors as rows you can run against your own organization. Every question is GSA’s, taken from the published agency data dictionary, with “Department or Agency” read as “business unit”. Score each row 0 to 4 using GSA’s ladder, average the rows within a factor, then average the three factor scores and rescale to 5. Where GSA published what federal agencies answered, the comparison sits next to the row, so you are scoring against a result rather than against a description of good practice.
Factor 1: Policy integration, nine rows at 11.11% each
GSA does not ask whether you have an accessibility policy. It asks how far accessibility is integrated into nine named business functions. The question wording is: “To what extent is ICT accessibility integrated into [function] at the Department or Agency?” and the answer ladder is Not integrated / Somewhat integrated / Moderately integrated / Mostly integrated / Fully integrated, plus “N/A - Department/Agency does not perform or have policies related to this function.”
| Row | Federal function | Read it as | Evidence that proves your score |
|---|---|---|---|
| 15a | Acquisition and Procurement | Purchasing, vendor management, contract templates | The standard contract template with the accessibility clause in it, and a revision date |
| 15b | Administrative Services | Facilities, office systems, internal service desks | The service catalog or intake form that asks about accessibility |
| 15c | Budget and Finance | Budgeting, capital planning | A budget line or an investment review checklist item |
| 15d | Communications | Marketing, comms, brand, publishing | The content standard or publishing checklist that content owners actually use |
| 15e | Emergency Response | Incident response, business continuity, emergency notifications | The notification runbook, including how alerts reach people who cannot hear or see them |
| 15f | Human Resources Management | Hiring, onboarding, internal HR systems | The onboarding curriculum and the accessibility requirement in job descriptions for relevant roles |
| 15g | Information Technology Services | IT operations, SDLC, platform standards | The definition of done, the release gate, or the architecture standard |
| 15h | Legal | Legal review, risk, contracts | The review checklist that flags accessibility obligations in customer contracts |
| 15i | Real Property Management | Facilities, kiosks, physical ICT | The kiosk or self-service device standard |
GSA’s own gloss on 15i is a useful calibration for anyone who assumed this row was about buildings rather than technology: it covers “audio/visual equipment in rooms, elevators with voice controls, digital signage (e.g., for environmental controls or conference room information), integrated wayfinding systems, and facility maintenance tracking systems.”
The federal comparison is instructive here because it isolates the failure GSA singles out. Forty-eight of 60 agencies (80 percent) have an agency-wide Section 508 or ICT accessibility policy, and 12 have none. Of the 48 that have one, 34 publish it, 32 include “authorities, roles and responsibilities, and expectations,” 35 include documented processes for Section 508 issues and complaints, and only 20 “include documented processes and procedures for Section 508 conformance testing.” GSA names the pattern: “Although many agencies maintain standalone Section 508 policies, related policies governing acquisition, IT, communications, and other core functions often do not fully integrate accessibility requirements. This fragmentation weakens enforcement, contributes to inconsistent implementation, and increases the risk of developing or procuring inaccessible ICT.”
If you have a policy document and cannot point at a second document from a different function that references it, you are scoring 1s across most of this table, whatever the policy says.
This factor is fixable in-house. It costs writing time and a governance decision, not testing capacity.
Factor 2: ICT acquisition and procurement, six rows at 16.66% each
Six questions, published verbatim by GSA, and they translate to a private organization with almost no editing. The wording below is condensed; the full text is in the data dictionary. All six use the same frequency ladder, with the percentage bands GSA attaches to each answer: Never (0%), Rarely (1-10%), Sometimes (11-50%), Often (51-90%), Almost always (+90%). Those bands are what stop this factor from being scored by feel, so use them literally.
| Row | Question | Federal agencies answering “almost always” |
|---|---|---|
| Q22 | How often is Section 508 compliance considered in market research | 38% |
| Q23 | How often do ICT solicitations include all applicable ICT accessibility requirements | 48% |
| Q24 | How often is Section 508 compliance considered in the technical evaluation of proposals prior to award | 42% |
| Q25 | How often do contracts include compliance or performance clauses to hold vendors accountable | 38% |
| Q26 | How often are nonconformance issues escalated to vendors or contractors | 45% |
| Q27 | How often are ICT deliverables from a contract verified for Section 508 conformance | 30% |
GSA’s question text for Q25 is worth quoting in full when you are drafting your own clause set, because it names what a usable clause contains: “compliance or performance clauses (e.g., remediation responsibilities, non-compliance penalties, response and resolution times for accessibility issues, etc.) included in contracts to hold vendors accountable for providing accessible ICT.”
There is also a published acceptance criterion for Q23, which stops the row from being scored generously. GSA’s FAQ says: “‘All applicable requirements’ for this question mean the agency has identified accessibility requirements and inserted those into each solicitation. A blanket copy and paste of all applicable Section 508 requirements would not suffice for this answer.” If your RFP template pastes the full standard into every solicitation regardless of what is being bought, that row scores low, not high. The clause structure and the quality assurance surveillance plan that makes it enforceable are worked through in Section 508 contract clauses and the QASP that enforces them.
The federal pattern in that table is a straight line down. Requirements get set far more often than they get verified. Only 30 percent of agencies “almost always” verify ICT deliverables for Section 508 conformance, and per GSA’s narrative, 23 percent do so only “sometimes” and 26 percent “rarely” or “never” verify deliverables at all. Agencies say so themselves about why: “vendor-provided accessibility conformance reports remain inconsistent or unreliable, increasing the burden on agencies to independently validate conformance.” If you are on the receiving end of supplier ACRs and want a repeatable way to grade one instead of filing it, that is how to score a vendor ACR.
One adjacent finding belongs on your scoring page even though it sits outside the six rows. GSA asked whether agencies track their three Section 508 exception types, “Fundamental Alteration,” “Undue Burden” and “Best Meets,” and whether they maintain the alternative means plans those exceptions require. “Approximately half of agencies and more than half of components reported no tracking process for these exceptions,” and “approximately 67 percent of agencies and more than 70 percent of components reported that they do not create or maintain alternative means plans.” The private-sector analogue is the decision to ship or accept a nonconforming component anyway. If nobody can produce the list of those decisions and what was promised instead, your Q25 and Q27 rows are optimistic.
Two findings from this factor belong in your funding narrative, and they point in opposite directions. Integration pays: “Agencies reporting full integration averaged 4.74 (Very High), compared to 1.63 (Low) for agencies reporting no integration.” And integration is not enough: “Acquisition outcomes do not correlate meaningfully with conformance results of tested ICT (c-index) or Testing and Remediation outcome, indicating that stronger acquisition alone does not ensure accessible outcomes without validation and follow-through.”
This factor is also mostly fixable in-house, with legal and procurement.
Factor 3: Testing and remediation, six or seven questions per ICT type, 20% per ICT type
The five ICT types are hardware, software, public-facing electronic documents, public-facing web pages and internal web pages. The question sets are not identical across them. Hardware and software are asked six questions each (Q29a to Q29f, Q30a to Q30f). Public-facing electronic documents, public-facing web pages and internal web pages are asked seven (Q31a to Q31g, Q32a to Q32g, Q33a to Q33g). The seventh, automated testing frequency, is asked only for those three content types. There is no automated-testing question for hardware or software anywhere in the instrument.
| Question, asked per ICT type | Asked for | Federal reference point |
|---|---|---|
| a. Is there a standardized test process to determine Section 508 conformance for this ICT type | All five | Electronic documents 72%, public web pages 70%, software and internal web pages about 52%, hardware 30% |
| b. Is there a risk-based framework or approach to prioritize remediation for this ICT type | All five | Public web pages and electronic documents 55%, software 47%, internal web pages 47%, hardware 38% |
| c. Are specific timelines required for defect remediation | All five | ”Approximately 70 percent of agencies reported no required timelines across ICT types” |
| d. How often are all defects remediated within those timelines | All five | ”Where timelines exist, 80 percent to 90 percent of agencies reported remediating within those timelines” |
| e. Is usability testing conducted with people with disabilities prior to publication or deployment | All five | Only 12% to 17% of agencies, depending on ICT type |
| f. How often is manual Section 508 conformance testing performed prior to publication or deployment | All five | Frequency ladder. GSA reports public-facing web pages highest, hardware lowest, with “a large share of agencies reporting they ‘never’ or ‘rarely’ test hardware prior to deployment” |
| g. How often is automated Section 508 testing performed prior to publication or deployment | Electronic documents, public web pages and internal web pages only. Not asked for hardware or software | Frequency ladder. GSA reports “lower and inconsistent use on internal web content and electronic documents” |
Two questions sit outside this factor but belong on the same page when you score yourself. The tracking-mechanism question for each ICT type (Q29i, Q30i, Q31h, Q32h, Q33h) feeds the conformance index instead, and roughly half of agencies answered No: “Public-facing web pages: 24 agencies (40%) Intranet web pages: 31 agencies (52%) Electronic documents: 29 agencies (48%) Hardware: 31 agencies (52%) Software: 30 agencies (50%).” Q34 sits outside all four factors and asks whether the organization has “a process for consulting with individuals with disabilities or members of disability organizations when determining whether its digital services are accessible.” Only 28 percent of agencies do.
The timeline pair is the single most quotable result in the whole report for anyone writing a funding case, because it removes the excuse that this work is technically hard: “Agencies that establish clear remediation timelines and tracking mechanisms generally meet them, demonstrating that governance, not technical feasibility, is the primary constraint.” Roughly seventy percent have no timelines. Where timelines exist, 80 to 90 percent are met. The gap is a decision, not an engineering problem.
The usability testing row is easy to score generously by accident. It asks specifically about testing with people with disabilities before release, not about running an automated scan. Between 12 and 17 percent of federal agencies do it, and GSA draws the conclusion: “most agencies deploy ICT without validating real-world accessibility.” If you are working out what a defensible test target set looks like before you claim this row, the assistive technology pairings and the policy behind them are covered in which assistive technologies your test evidence has to name.
Unlike the first two factors, this one cannot be closed with writing time. The deliverable is test evidence. If you score Low here, the gap is testing capacity, and GSA’s own data says the gap is worth closing: it reports “a moderate positive correlation between Testing and Remediation outcomes and conformance outcomes.”
The conformance factor, and why coverage is the number that matters
Conformance is scored separately from implementation, and it is the outcome the whole report is measuring. Governmentwide it came in at 1.96. In GSA’s words, “agency conformance exhibited a wide variation, ranging from a minimum of 0 to a maximum of 4.94 on the 5-point scale.”
Before the numbers, one structural fact that changes how you read all of them. Every conformance conversion in GSA’s Appendix A is a ratio of conformant to tested, not conformant to owned. For hardware: “If data was provided for Q29l, the result is displayed as a percentage of total hardware that fully conforms out of total hardware tested.” The same construction repeats for software, documents and both kinds of web page. The index therefore rewards a narrow test scope, and GSA says so in prose: “Agencies that test a broader and more representative portion of their ICT portfolios tend to report lower average conformance, while agencies that test a narrower subset of ICT often report higher conformance rates within that limited scope. As a result, higher reported conformance does not necessarily indicate stronger enterprise-wide accessibility, particularly when testing coverage is incomplete or uneven across ICT types.”
For the most-viewed federal content, GSA reports the percentage fully conformant: public web pages 37 percent (48 of 60 agencies tested theirs), intranet web pages 41 percent (42 tested), public electronic documents 37 percent (45 tested), public videos 45 percent (45 tested). Less than half conformant, on the content with the most eyes on it. On average, 23 percent of agencies did not test at least one of their top-viewed ICT categories at all.
The more useful table for a self-assessor is the coverage one, because it separates what was tested from what passed. Each row rests on a different subset of the 60 agencies, so the agency count belongs in the table rather than in a footnote.
| ICT type | Agencies that submitted data (of 60) | Share of that ICT type tested in the past year | Of what was tested, share fully conformant |
|---|---|---|---|
| Public-facing web pages | 41 | 37% | 72% |
| Intranet web pages | 30 | 53% | 65% |
| Electronic documents | 38 | 25% | 38% |
| Hardware | 24 | 4% | 83% |
| Software | 27 | 5% | 47% |
Read the hardware row twice. Four percent tested, 83 percent of that four percent conformant, and that pairing comes from the 24 agencies that submitted hardware data at all. That is not an accessible hardware estate. It is the ratio working exactly as designed.
The same problem shows up in evidence retention. “Only 30% of agencies systematically track Section 508 conformance evidence for hardware and 40% for software,” with average evidence coverage of 43 percent for hardware and 54 percent for software, and ranges of 0 to 100 percent.
If you want a sanity check on whether your own testing is looking in the right places, the five most common defects in top-viewed federal public and intranet web pages are WCAG success criteria 1.1.1 Non-text Content, 1.3.1 Info and Relationships, 1.4.3 Contrast (Minimum), 2.4.4 Link Purpose (In Context) and 4.1.2 Name, Role, Value. For electronic documents they are 1.1.1, 1.3.1, 1.3.2 Meaningful Sequence, 2.4.2 Page Titled and 2.4.6 Headings and Labels. A test process that never produces findings against those criteria is not finding what everyone else finds.
When your buyer asks whether your test evidence is acceptable, coverage is the first thing they should be checking, and the three questions behind that judgment are set out in will you accept our test evidence?.
Where you land: the four quadrants
GSA sorts agencies into four quadrants by implementation against conformance, with the boundary at 2.5 on each axis, publishes the count in each, and publishes a recommended action for each. This is the output structure a self-assessment should map onto, because it produces a federally authored recommendation rather than an opinion.
| Quadrant | Agencies | What it means | GSA’s published recommendation |
|---|---|---|---|
| III: Higher implementation, higher conformance | 16 | Policy, procurement and testing all working, and the output conforms | ”Continue investment and a focus on continuous process improvement activities to see incremental improvements in both inputs (integration, acquisitions, testing) and outputs (ICT conformance).” |
| IV: Higher implementation, lower conformance | 20 | Good policy and procurement, output still fails | ”Prioritize investment in the execution of testing processes and ways to implement established policy and standard operating procedures to increase conformance.” |
| II: Lower implementation, higher conformance | 3 | Conformant output without the governance to sustain it | ”Prioritize investment in the developing processes and developing policies that champion and institute ICT accessibility across the enterprise.” |
| I: Lower implementation, lower conformance | 21 | No governance and no conformance | ”Focus on establishing baseline governance by assigning ownership, adopting core policies and procedures, and prioritizing testing and remediation for high-impact ICT, leveraging shared services and existing federal resources.” |
Quadrant IV kills the obvious objection in a budget meeting, which is some version of “we already have a policy.” Twenty agencies have higher implementation and lower conformance. GSA’s reading: “The presence of a notable group of agencies where higher implementation levels do not correspond with higher conformance outcomes suggests potential challenges related to the quality of accessibility practices or gaps between implementation activities and measurable results.”
Three worked examples, all of them public and all of them checkable in the published response file.
GSA is in quadrant IV. The agency that writes the report scored Very High on Policy Integration, High on Acquisition, Low on Testing and Remediation, High on the Implementation index, and Very Low on Conformance. Best-in-class governance, bottom band on the outcome.
The Social Security Administration is the opposite pole. Very High on all four factors. Its published answers show the mechanism: all nine business functions Fully integrated, five of the six acquisition questions answered “Almost always (+90%)” with market research at “Often (51-90%)”, and it is one of the minority that runs usability testing with people with disabilities on public web pages before publication. Computed from GSA’s published FY 2025 agency response file, only three of the 60 reporting agencies scored Very High on all four factors: the Social Security Administration, the Access Board and the National Mediation Board. Three out of sixty is the honest denominator for anyone being told that a Very High score is the reasonable first-year target.
Size is not the variable. GSA found that “an agency’s size was not a determining factor for overall conformance levels. Agencies of various sizes were distributed across all five performance outcome categories (Very Low to Very High).”
The funding case
Now the part that decides whether the assessment turns into anything. Three findings from the same dataset do most of the work, and one of them will surprise the person holding the budget.
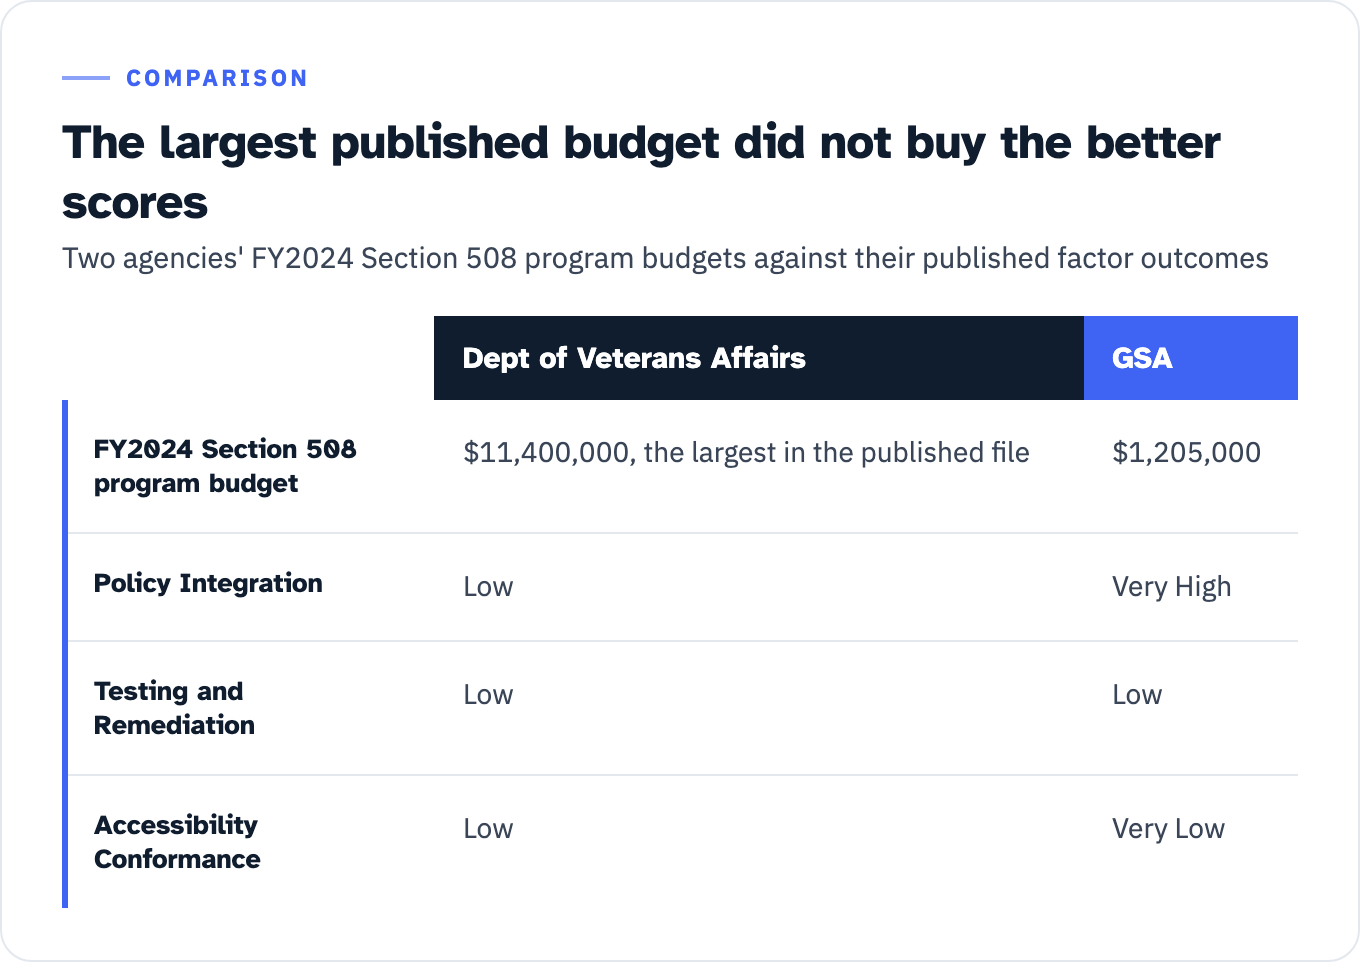
Money is not the variable either. The Department of Veterans Affairs reported the largest FY2024 Section 508 program budget in the published file, $11,400,000, and scored Low on all four factors. GSA reported $1,205,000 and scored Very High on Policy Integration, Low on Testing and Remediation and Very Low on Conformance. Do not build the ask on the size of the number. Build it on where the money goes.
View the data as a table
| Dept of Veterans Affairs | GSA | |
|---|---|---|
| FY2024 Section 508 program budget | $11,400,000, the largest in the published file | $1,205,000 |
| Policy Integration | Low | Very High |
| Testing and Remediation | Low | Low |
| Accessibility Conformance | Low | Very Low |
Dedicated hours track with conformance, weakly. Of 60 agencies, 17 have a full-time Section 508 program manager, 35 have a part-time program manager averaging 8.90 hours a week, and eight have no designated program manager at all, four of which nonetheless report having a program. Across all 60 agencies the total staffing is 120 federal FTEs plus 110 contractor FTEs. GSA reports “a slight positive relationship between the average hours per week an agency Section 508 PM dedicates to program activities and the conformance outcomes for that agency,” and concludes that “Agencies tend to have more conformant ICT when the Section 508 PM can dedicate more time to the Section 508 program.” Quote the qualifier along with the finding, because a reader with the report open will find it. A slight relationship is still the only published signal that speaks directly to staffing, and it argues against the outcome the federal numbers show is normal: only 17 of 60 fund a full-time owner, 35 add the work to somebody’s existing job at under nine hours a week, and eight name nobody.
Tooling that tracks the work correlates too. Only 30 percent of agencies and 33 percent of components use a governance, risk and compliance tool to manage Section 508 compliance, and those that do “achieved significantly higher Testing and Remediation and overall Conformance outcomes than those without GRC tools.”
On the question of what a program like this costs, GSA publishes each agency’s answer to “In FY2024, what was the Department or Agency’s estimated budget for its Section 508 program?” Computed from GSA’s published FY 2025 agency response file, only 31 of 60 agencies track Section 508 spending at all, and among the 29 that both track it and reported a usable figure, the median is $488,089, with a spread from $4,000 (Office of Government Ethics) to $11,400,000 (Department of Veterans Affairs). Named anchors across the size range include the Pension Benefit Guaranty Corporation at $27,200, the Nuclear Regulatory Commission at $216,621, the Department of Justice at $391,101, the National Archives and Records Administration at $430,300, the Federal Trade Commission at $488,089 (the median itself), the Department of Transportation at $508,145, the Securities and Exchange Commission at $801,305, the Department of Education at $1,500,000, the Department of Homeland Security at $2,183,000 and the Social Security Administration at $5,250,000.
Gate that column on the tracking question before you use it, as the derivation above does. Three agencies reported a budget figure while answering No to “Does the Department or Agency track its spending for implementing and complying with Section 508?”, and one of the three reported a budget of $1. GSA’s own methods appendix warns that “due to tool issues, the submitted response data may still contain some degree of incompleteness or inaccuracy, or include responses where fields should have been left blank.”
Treat the gated range as a published reference for what a real accessibility program costs a real organization, not as a market rate. These are self-estimated federal program budgets, and federal program budgets do not map cleanly onto a private cost structure. Their value is that they are public, dated, attributable and impossible to dismiss as a vendor’s pricing.
The phased plan
Each tranche should name the factor score it moves and the dated obligation it protects. On the dates: neither of the two 2027 deadlines is a Section 508 date, and which one applies to you depends on what you are. 26 April 2027 is 28 CFR 35.200(b)(1) under ADA title II, binding “a public entity, other than a special district government, with a total population of 50,000 or more” to WCAG 2.1 Level A and Level AA for web content and mobile apps. 11 May 2027 is 45 CFR 84.84(b)(1) under section 504 of the Rehabilitation Act, binding “a recipient with fifteen or more employees” to the same standard, where recipient means a recipient of HHS federal financial assistance. Both were extended by 2026 interim final rules, so check you are quoting the current dates: DOJ’s rule of 20 April 2026 moved title II from 24 April 2026 to 26 April 2027 (and small entities and special district governments to 26 April 2028), and HHS’s rule published 11 May 2026 moved section 504 from 11 May 2026 to 11 May 2027 (and recipients with fewer than fifteen employees to 10 May 2028). If you are a supplier rather than a covered entity, these are your customer’s dates, and they reach you through the contract.
| Phase | What it buys | Factor it moves | What drives the cost | Dated obligation it protects |
|---|---|---|---|---|
| 1. Named owner and protected hours | One person accountable, with hours in the calendar rather than goodwill | Precondition for all four; GSA reports a slight positive relationship between program manager hours and conformance | Whether the role is full-time or a slice of an existing one. Federal reference: 17 agencies full-time, 35 part-time at 8.90 hours a week, 8 with nobody named | None directly. Nothing else in this table is deliverable without it |
| 2. Policy integration into the nine functions | Accessibility written into procurement, IT, comms, HR, legal and facilities policy, not a standalone document | Policy Integration, currently 3.04 governmentwide | Number of policy owners to negotiate with. Writing time, not testing capacity | None directly |
| 3. Acquisition clauses and acceptance verification | Requirements identified per solicitation, compliance and performance clauses, and a verification step before acceptance | ICT Acquisition and Procurement, currently 3.44. Full integration averages 4.74 against 1.63 for none | Number of live ICT contracts and their renewal dates | Your customers’ 26 April 2027 and 11 May 2027 dates, which arrive as contract terms |
| 4. Standardized test process, tracking mechanism and remediation timelines | A documented process per ICT type, a place the results live, and timelines somebody owns | Testing and Remediation, currently 2.00 and the weakest factor | Number of ICT types in scope and the size of the top-viewed inventory. Roughly half of agencies have no tracking mechanism at all | 26 April 2027 if you are a covered public entity; 11 May 2027 if you are an HHS recipient with fifteen or more employees |
| 5. Independent conformance testing and an ACR per product | Test evidence and a conformance report a procurement reviewer can act on | Accessibility Conformance, currently 1.96 | Number of products, number of platforms, whether electronic documents are in scope | Whatever date is on the next RFP or customer accessibility questionnaire, plus the two regulatory dates above where they apply |
| 6. Role-based training | The people who create ICT stop generating the same defects | Sustains factors 1 to 4 | Number of roles and headcount per role | None directly. Without it, phases 2 to 5 decay |
Phase 6 is worth its own line in the ask because the federal numbers are stark. Only 16 agencies (27 percent) and 38 components (25 percent) require mandatory Section 508 training of any kind, and among the 16, “most require annual training, but the others require only one-time or irregular training.” Role-specific requirements are rarer: 20 percent require additional training for acquisition professionals, 23 percent for developers, 22 percent for document authors, 28 percent for testers and 28 percent for web content managers, and “55 percent of agencies require none of these groups to take role-specific Section 508 training, despite their direct responsibility for accessibility implementation and conformance outcomes.”
You are not inventing this plan. GSA’s own recommendations to federal agencies name the same levers: put the Chief Information Officer in charge of integration, “Include Section 508-related metrics in CIO performance plans,” “Integrate Section 508 compliance into the risk analysis for major ICT investments and ATO reviews to ensure ICT accessibility is a part of core IT governance,” and “Require annual Section 508 training for all employees who create, maintain, or contribute to agency ICT by embedding accessibility training by roles and responsibilities into mandatory onboarding and annual learning requirements.” Borrow the wording. It is a federal recommendation, not a consultant’s opinion.
If the shape of phases 4 and 5 is the open question, the differences between an audit, a remediation engagement and an ongoing testing retainer are compared in what different accessibility consulting engagements actually deliver, and the independent testing and evidence work sits under our Section 508 compliance services.
One honest limitation
No private-sector organization has publicly scored itself against these four factors, at least not that we could find. This is a method being proposed, not established practice. What makes it defensible anyway is that every component of it is published by a federal agency under a statutory mandate: the question bank, the weights, the answer ladder, the bands, the governmentwide averages and the per-agency results. If somebody challenges your score, you can hand them the source and let them recompute it.
Do this before the end of the week
Open GSA’s published question bank and response file at section508.gov/manage/section-508-assessment/2025/assessment-data-downloads. Answer the nine policy integration questions and the six acquisition questions for your own organization, then the testing questions for each ICT type you actually own: six for hardware, six for software, seven each for electronic documents, public web pages and internal web pages. Score them 0 to 4, average within each factor, and write the three numbers on one page next to 3.04, 3.44 and 2.00.
Take that page to whoever controls the budget line, with the quadrant you landed in and the phase you want funded first. If Testing and Remediation came back Low, that is the factor to fund first and the one least likely to move without outside hands, because it is the only one on the list where the deliverable is evidence rather than a document.