
Who gets sued: reconciling web accessibility lawsuit data
 By David LoPresti July 22, 2026
 Five numbers, three publishers
You have a board paper, a budget request or an insurance renewal due, and you need one number for web accessibility litigation volume in 2025. The first four sources you find give you 3,117, 3,948, 4,928 and “more than 5,000”. A colleague sends a fifth figure, 8,667, which turns out to measure something else entirely. Three publishers produced all five. They count different things, from different sources, over different windows. Each states a scope. Not all of them state a window, a source list or a deduplication rule, and that is where the discrepancies live.
This page puts the methodologies side by side, shows which components reconcile arithmetically and which do not, and names the figure that survives questioning in a board paper. Then it does the part no filing dataset can do for you. If you are a state agency, a school district or a public university, these datasets are close to silent on your exposure, and your sector’s small share of them reflects the instrument rather than your obligation. If you are a hospital or an HHS-funded provider, the datasets under-count you rather than miss you, and the two publishers that break healthcare out disagree about by how much.
One boundary first. What follows is data sizing, not legal advice. Case strategy and any assessment of your own exposure belong to your counsel.
The four numbers for calendar 2025
Seyfarth Shaw, 3,117. The firm’s ADA Title III blog reported on 25 March 2026 that “the total number of lawsuits filed in federal court alleging that plaintiffs with a disability could not use websites because they were not designed to be accessible and/or work with assistive technologies in 2025 was 3,117. This number is 665 more than 2024’s total of 2,452, representing a 27% increase.” The method is stated on the same page: keyword searches of Courthouse News Services data, followed by manual review of the entries to remove lawsuits that concern websites but not website accessibility. The firm adds that cases may be missed “if their descriptions did not include the keywords.”
EcomBack, 3,948. Its annual 2025 report states that “a total of 3,948 lawsuits were filed, which is 23.84% higher than 2024 (3,188).” Its published sources are PACER, CourtLink “and state court case search portals,” over 1 January to 31 December 2025.
UsableNet, three artifacts, three answers. Its 2025 year-end report charts 3,195 federal cases (62 percent) beside 1,919 New York and California state cases (38 percent), which sums to 5,114, a total the report itself does not print. The narrative of the same PDF says the team “reviewed more than 5,000 ADA-related digital accessibility lawsuits filed in federal and state courts.” The publisher’s ADA website compliance lawsuit tracker page answers the same question with an exact figure that matches neither: “By the end of 2025, plaintiffs filed 4,928 web accessibility lawsuits.” A UsableNet blog post of 8 January 2026 restates it as “more than 5,000.” Each number belongs to a specific artifact. Cite the artifact you read.
Seyfarth, 8,667, which is not a website figure. The same firm’s wider series records “8,667 ADA Title III lawsuits filed in or removed to federal district courts in 2025, 2% fewer than in 2024.” That is the denominator, not the website count. Against it, website accessibility suits were “36% of the total number of ADA Title III lawsuits filed in federal court in 2025 (3,117 out of 8,667 cases),” against 28 percent in 2024 (2,452 of 8,800).
The reconciliation table
| Publisher and artifact | Scope | Data source | Window | Unit of count | 2025 figure | Cadence | What this dataset structurally cannot see | Use in a board memo |
|---|---|---|---|---|---|---|---|---|
| Seyfarth Shaw, adatitleiii.com post of 25 Mar 2026 | Federal district courts only, website accessibility subset of ADA Title III | Courthouse News Services, keyword search plus manual review | 1 Jan to 31 Dec 2025 | Lawsuit alleging a website was not usable with assistive technology | 3,117 | Annual, with a state and a monthly table | State-court filings, demand letters, Title II matters against public entities (culled by hand from the parent series), keyword misses | Yes, when your footprint is a commercial defendant with federal exposure and you need a single publisher’s series back to 2017, with the Courthouse News keyword method stated for 2024 and 2025 |
| Seyfarth Shaw, adatitleiii.com post of 11 Feb 2026 | Federal district courts, all ADA Title III | Manual pass over cases coded “ADA-Other” | Calendar 2025 | Any ADA Title III filing or removal | 8,667 | Annual | Same exclusions, and it is not a website measure | Only as the denominator behind the 36 percent share |
| UsableNet 2025 year-end report (PDF) | Federal courts plus “key state courts, including New York and California” | Publisher’s research team “across multiple legal sources” | 1 Jan to 15 Dec 2025 | ”All digital accessibility lawsuits involving websites, mobile apps, and video content” | 3,195 federal and 1,919 state, narrative “more than 5,000” | Year-end, midyear and a monthly tracker | State filings outside New York and California, demand letters, Title II and Section 504 administrative matters, the last two weeks of December | Yes, when your product surface includes a mobile app or video, and only if you print both components and the 15 December cutoff |
| UsableNet lawsuit tracker page | Same as above, restated | ”The UsableNet Research Team,” with no source list on the page | Calendar 2025 in the FAQ, plus monthly counts | ”Any claims filed in court under a disability discrimination law against a website, mobile app, or video content” | 4,928 | Monthly | Same, and the page names no source list and no deduplication rule | Only if you cite the tracker page itself, never blended with the PDF’s components |
| EcomBack annual 2025 report | Federal plus state, nationwide | PACER, CourtLink, state court case search portals | 1 Jan to 31 Dec 2025 | ADA website accessibility lawsuit | 3,948 | Annual plus quarterly recaps | Demand letters, Title II and Section 504 administrative matters, state courts with weak public indexing (the publisher says so) | Yes, when your footprint includes California, where the federal-only series reads as four filings against EcomBack’s 787, or any state whose activity has moved into state court |
| EcomBack Q1 2026 recap | Federal plus state, nationwide | Not stated on that page | 1 Jan to 31 Mar 2026 | ADA website accessibility lawsuit | 1,037 | Quarterly | Same, and the page carries no methodology statement of its own | Only as a labeled partial period, with the annual report cited for method |
Two limitations apply to every row and no publisher resolves them. Nobody states whether a matter appearing on both a state and a federal docket is counted once or twice, and nobody publishes a deduplication rule across PACER, CourtLink and state portals. Without a published rule, there is no basis for adding a federal series to a state series.
Why the totals differ, shown in arithmetic
Three checks settle the scope question without any appeal to authority.
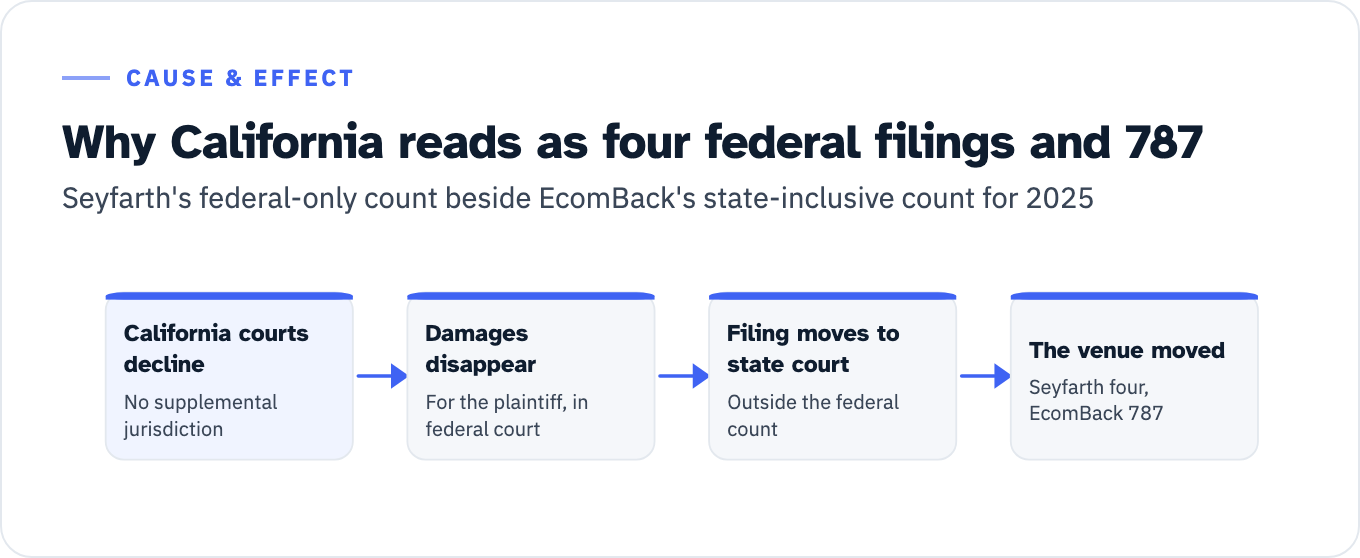
California, four against 787. Seyfarth’s 2025 state table gives California four federal website accessibility filings: “Remarkably, California’s federal courts only had four new website accessibility lawsuits last year.” EcomBack’s 2025 state table gives California 787 (19.93 percent of its total) for the same year and the same subject matter. Both can be right, and Seyfarth supplies two causes on its own pages. On the website post: “in California, both federal and state courts of appeals have reached the conclusion that online only businesses are not covered by the ADA, making it virtually impossible for plaintiffs to file viable lawsuits against online-only businesses for accessibility violations,” followed by “However, we still see a significant number of demand letters and lawsuits filed in state courts, which are not included in our federal lawsuit numbers, especially against businesses with physical locations.” On the wider Title III post: “In the past few years, California courts have been aggressively declining supplemental jurisdiction over state law claims in cases alleging ADA Title III violations, thereby eliminating monetary damages for the plaintiff. As a result, many plaintiffs have opted to file in state court.” The conclusion available from these two tables is that the venue moved. It is not that the exposure fell.
View the data as a list
- California courts decline: No supplemental jurisdiction
- Damages disappear: For the plaintiff, in federal court
- Filing moves to state court: Outside the federal count
- The venue moved: Seyfarth four, EcomBack 787
The same publisher’s own filter flips the state ranking. In Seyfarth’s all-Title-III series, “California retained its top spot with 3,252 lawsuits,” while in its website subset California is eleventh of the twelve jurisdictions charted, with four. The two series are not the same count narrowed by topic: the parent series is a manual pass over federal cases coded “ADA-Other,” and the website series is a keyword search of Courthouse News Services data. One publisher, one year, a different source and a topic filter, and first place becomes second from last.
UsableNet’s federal figure exceeds Seyfarth’s over a shorter window. UsableNet counts 3,195 federal cases to 15 December 2025. Seyfarth counts 3,117 to 31 December. A shorter window producing a larger count is the signature of a broader unit of count, and UsableNet publishes that unit: lawsuits “involving websites, mobile apps, and video content.” A website-only filter removes cases a website-plus-app-plus-video filter keeps.
Three arithmetic checks are worth running before you cite either series, because all three pass and that is reassuring. Seyfarth’s monthly 2025 table sums to exactly 3,117, its state table sums to exactly 3,117, and EcomBack’s 2025 state table sums to exactly 3,948. When a table in one of these reports does not reconcile to its own headline, you have found a transcription problem rather than a disagreement.
One phrase in the UsableNet report should be quoted rather than repeated. The report says it “covers cases filed across all 14 federal circuit courts.” Per uscourts.gov, there are 13 federal courts of appeals, 12 regional circuits plus the Federal Circuit, and the 94 district courts are where ADA cases are filed. Attribute the phrase to its author and describe the court structure from the source.
The sentence to put in the board paper
Write the scope into the sentence, not into a footnote:
In calendar 2025, Seyfarth Shaw identified 3,117 website accessibility lawsuits filed in United States federal district courts, up 27 percent on 2,452 in 2024, using keyword searches of Courthouse News Services data (published 25 March 2026). The figure excludes state-court filings and demand letters, both of which the publisher states it does not count.
Then pre-answer the two questions a director will ask.
The number a director read last week was different because it counted state courts, or mobile apps and video, or a different window. Name the artifact behind each figure and the two stop competing.
They cannot be added into a single total. No publisher states a deduplication rule across dockets, and the same matter can appear in more than one series. If a total across venues is needed, use EcomBack’s single nationwide figure of 3,948 for 2025, cite its method, and stop there.
Sector split: two axes, not two estimates
UsableNet’s 2025 industry table, reproduced in full because seven categories sit below the row labeled “Other”. The source prints those seven as less than 1 percent:
| Industry | Share of 2025 filings |
|---|---|
| eCommerce | 70% |
| Food Service Industry | 21% |
| Healthcare | 2% |
| Fitness & Wellness | 2% |
| Entertainment & Leisure | 1% |
| Travel/Hospitality | 1% |
| Education | 1% |
| Other | 1% |
| Banking/Financial | under 1% |
| Automotive | under 1% |
| Digital Media & Agencies | under 1% |
| Self-Service | under 1% |
| Insurance | under 1% |
| Telecommunications | under 1% |
| Real Estate Agencies & Properties | under 1% |
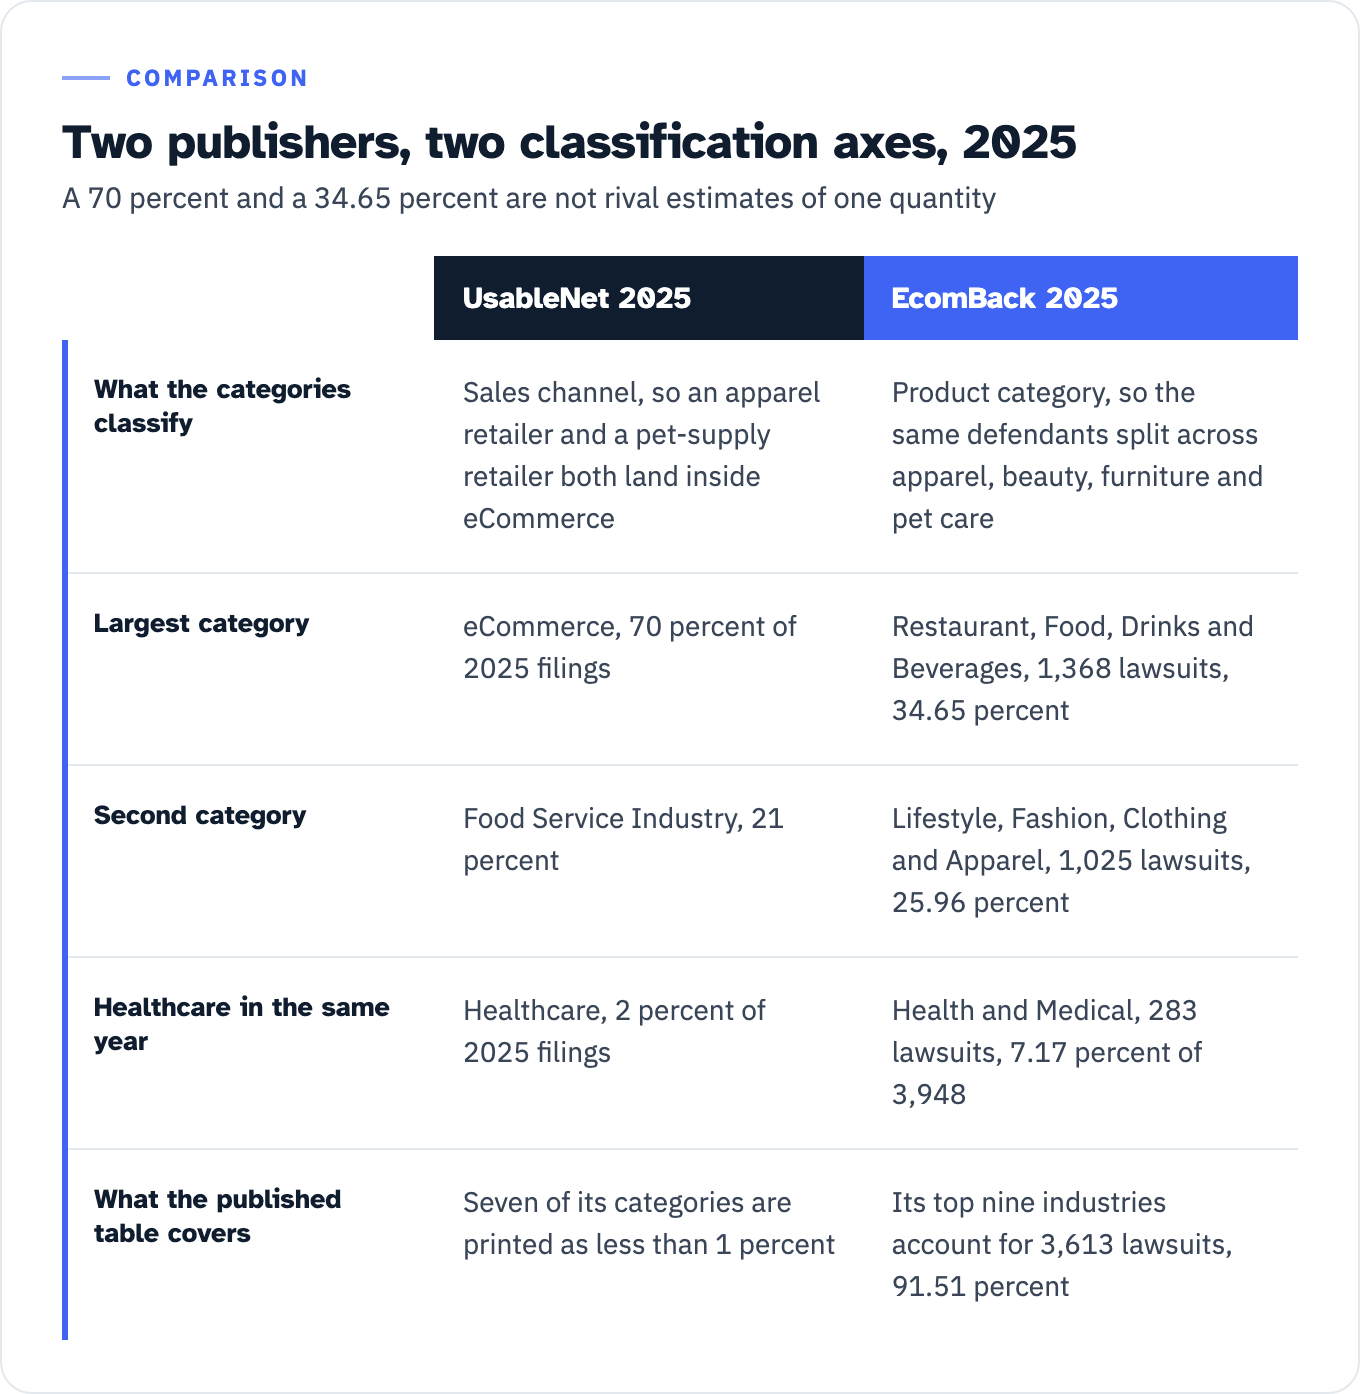
EcomBack’s 2025 table answers a different question. Its top nine industries account for 3,613 lawsuits (91.51 percent), led by “Restaurant, Food, Drinks & Beverages” at 1,368 (34.65 percent) and “Lifestyle, Fashion, Clothing & Apparel” at 1,025 (25.96 percent).
These two tables must not be charted on a shared scale. UsableNet classifies by sales channel, so an apparel retailer and a pet-supply retailer both land inside eCommerce. EcomBack classifies by product category, so the same defendants split across apparel, beauty, furniture and pet care. A 70 percent and a 34.65 percent here are not rival estimates of one quantity, and any table that prints them as competing figures has invented a comparison the sources do not support.
The gap shows up inside a single sector. Healthcare is 2 percent of UsableNet’s 2025 filings. EcomBack’s “Health & Medical” category is 283 lawsuits, 7.17 percent of its 3,948. Same year, same subject, a factor of three apart, because the two publishers are cutting different populations along different axes.
View the data as a table
| UsableNet 2025 | EcomBack 2025 | |
|---|---|---|
| What the categories classify | Sales channel, so an apparel retailer and a pet-supply retailer both land inside eCommerce | Product category, so the same defendants split across apparel, beauty, furniture and pet care |
| Largest category | eCommerce, 70 percent of 2025 filings | Restaurant, Food, Drinks and Beverages, 1,368 lawsuits, 34.65 percent |
| Second category | Food Service Industry, 21 percent | Lifestyle, Fashion, Clothing and Apparel, 1,025 lawsuits, 25.96 percent |
| Healthcare in the same year | Healthcare, 2 percent of 2025 filings | Health and Medical, 283 lawsuits, 7.17 percent of 3,948 |
| What the published table covers | Seven of its categories are printed as less than 1 percent | Its top nine industries account for 3,613 lawsuits, 91.51 percent |
How enforcement actually reaches your sector
| Sector | Share of the filing datasets | The mechanism that actually reaches it | The dated artifact to plan against |
|---|---|---|---|
| Ecommerce, retail | 70% of UsableNet’s 2025 filings | Private ADA Title III suits in federal court, plus state-court filings, which Seyfarth attributes in New York to “the migration of plaintiffs to New York and New Jersey state court after the federal courts started applying more rigorous standing requirements in website accessibility cases” | Neither the Title II nor the Section 504 rule sets a date for a purely private commercial site. The exposure is a filing, and Seyfarth’s 2025 monthly range of 219 to 319 shows it arrives in every month |
| Food service | 21% | Same, and Seyfarth notes state-court activity “especially against businesses with physical locations” | Same |
| Healthcare, HHS-funded providers | Healthcare 2% of UsableNet’s filings, Health & Medical 7.17% of EcomBack’s | The Section 504 web and mobile app rule for recipients of HHS funding, administered by HHS OCR, plus Title III for public-facing sites | 11 May 2027 for recipients with 15 or more employees, 10 May 2028 for smaller recipients |
| Education, K-12 and higher ed | Education 1% | Title II for public institutions, Section 504 for recipients of HHS funding, and Education Department OCR complaints and compliance reviews | 26 April 2027 or 26 April 2028 under Title II. If the institution also receives HHS financial assistance, 11 May 2027 or 10 May 2028 under the HHS Section 504 rule |
| State and local government | Not separately reported. Seyfarth culls Title II defendants out of the parent Title III series by hand and says so; EcomBack and UsableNet publish no public-entity breakdown either way | The Title II rule at 28 CFR 35.200 to 35.205, reached through administrative complaint and compliance-review channels. No private-filing tracker covers this sector | 26 April 2027 for entities of 50,000 population or more, 26 April 2028 for smaller entities and special district governments |
| Federal agencies and their suppliers | Not present. These series count private suits against commercial defendants under the ADA and state disability statutes, and Section 508 rather than the ADA is what binds federal agencies and the vendors selling to them | The obligation arrives through the solicitation and the acceptance of deliverables, not through private Title III litigation | Set by the contract, not by any national filing count |
The dates in that last column are current and they moved recently. The Title II web rule was a final rule published 24 April 2024 at 89 FR 31320, codified at 28 CFR 35.200 to 35.205. DOJ then extended the compliance dates by interim final rule published 20 April 2026 at 91 FR 20902: “The compliance date for State and local government entities with a total population of 50,000 or more is extended from April 24, 2026, to April 26, 2027. The compliance date for public entities with a total population of less than 50,000, or any special district government, is extended from April 26, 2027, to April 26, 2028.” That rule took effect on publication and its comment period closed 22 June 2026. The current codified text of 28 CFR 35.200 carries the new dates and keeps the standard unchanged: Level A and Level AA success criteria and conformance requirements of WCAG 2.1. For which US rule points at which WCAG version, see WCAG version requirements by rule.
HHS made the parallel move for Section 504 by interim final rule published 11 May 2026 at 91 FR 25496, docket HHS-OCR-2026-0133. Its title names the population it reaches: recipients of Departmental financial assistance. Recipients with 15 or more employees move from 11 May 2026 to 11 May 2027, and recipients with fewer than 15 employees from 10 May 2027 to 10 May 2028. That rule is effective 7 May 2026. A district or university with no HHS funding does not pick up these dates from this rule.
Both extensions are contested. On 21 May 2026 the National Federation of the Blind filed suit against DOJ and HHS in Maryland federal court under the Administrative Procedure Act, arguing the agencies had no valid good cause to bypass notice and comment and that the extensions were arbitrary and capricious. Seyfarth’s summary of the complaint states that the plaintiff asks the court “to declare the extensions illegal, vacate (i.e., set aside) the Interim Final Rules entirely, and Order DOJ and HHS to enforce the original deadlines from the 2024 final rules.” Read that as one year of extra runway that a court has been asked to remove, and plan against the earlier date if your delivery window has no slack.
The channel no tracker counts
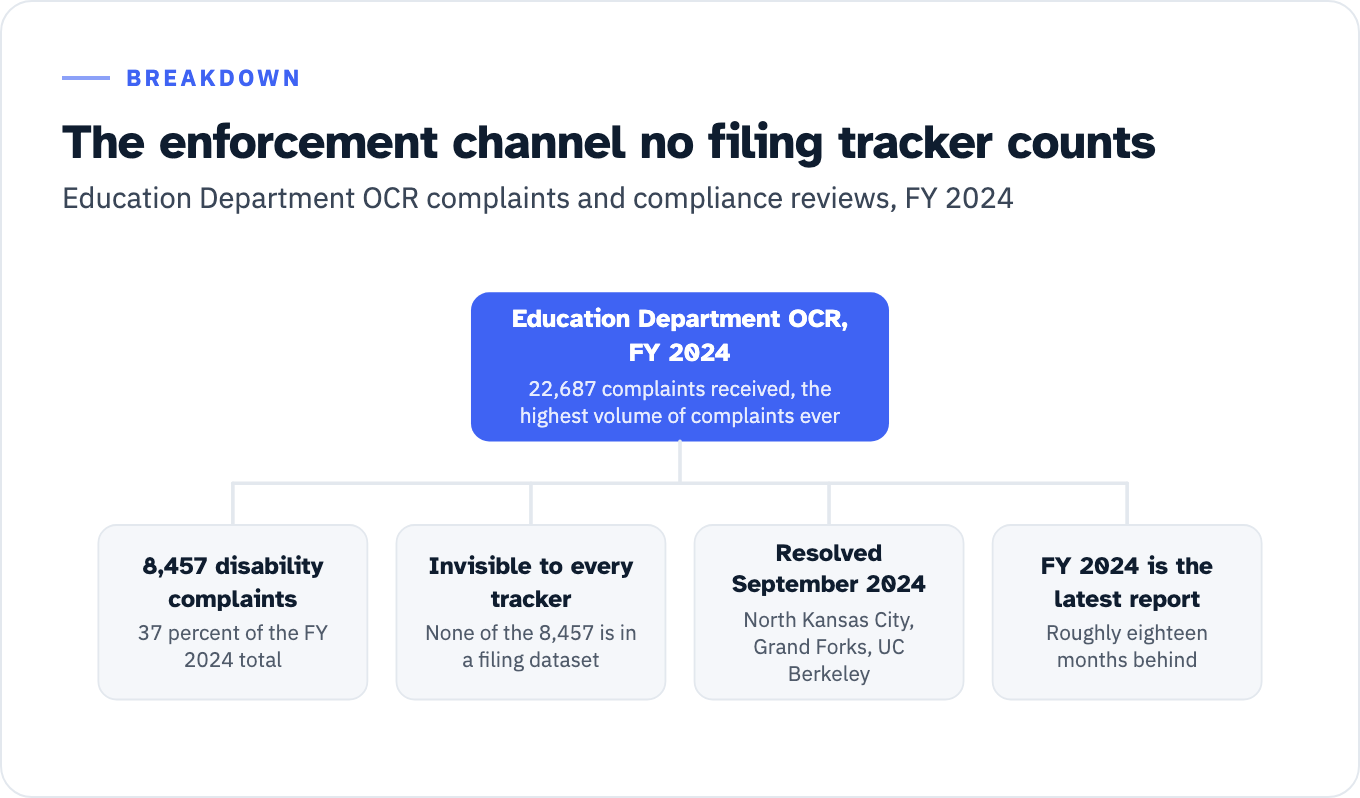
The Education Department’s Office for Civil Rights reported that in FY 2024 it received 22,687 complaints, “the highest volume of complaints ever” and “an 18% increase over our previous record high in FY 2023 of 19,201 complaints.” Complaints containing disability discrimination allegations were 37 percent of the total, 8,457 of them. Two cautions from the same report: the categories do not sum to the total, because a complaint can cover more than one statute, and the footnote about 6,749 complaints filed by a single individual attaches to the sex discrimination bar, not the disability bar. The report also states that complaint volume has “almost tripled since FY 2009” while over the same period the office’s full-time equivalent staffing fell from 629 to 588.
Not one of those 8,457 complaints appears in any filing dataset above. The same report supplies worked examples of what the administrative channel produces, complaint-driven and OCR-initiated alike. Matters at North Kansas City School District in Missouri and Grand Forks Public Schools in North Dakota, both OCR-initiated compliance reviews resolved in September 2024, addressed keyboard navigation, unlabeled form fields and links, inaccessible PDFs and insufficient contrast across public websites, third-party sites, parent portals and enrollment platforms. A University of California, Berkeley matter resolved the same month concerned two web applications required for employment, CalTime and SumTotal, and produced remediation commitments from the Regents reaching across the University of California system. None of the three is a lawsuit, and none of the three is visible to any tracker in the table above.
FY 2024 is the most recent annual report on the department’s annual reports index as read on 27 July 2026, so this channel’s public data runs roughly eighteen months behind the litigation trackers. HHS OCR publishes no comparable annual complaint count, so no healthcare figure of that kind appears here. The healthcare row above rests on the Section 504 rule and its 11 May 2027 date.
View the data as a list
Education Department OCR, FY 2024: 22,687 complaints received, the highest volume of complaints ever
- 8,457 disability complaints: 37 percent of the FY 2024 total
- Invisible to every tracker: None of the 8,457 is in a filing dataset
- Resolved September 2024: North Kansas City, Grand Forks, UC Berkeley
- FY 2024 is the latest report: Roughly eighteen months behind
The inaccessible-PDF finding in those school district matters is the part that turns into a work program rather than a fix, and it is worth sizing before the date rather than after: see triaging a legacy document inventory against a 2027 deadline.
Widgets are in the filing data, on the defendant side
EcomBack counts 983 of its 3,948 lawsuits for 2025, 24.90 percent, “filed against websites with a widget present,” up from 722 lawsuits (22.65 percent) in 2024. Its Q1 2026 recap puts the figure at 265 (25.55 percent), up from 209 a year earlier. It breaks the 983 down by detected vendor and states that the top five vendors account for 869 of them, 88.40 percent.
UsableNet’s 2025 monthly series for filings against companies using widgets sums to 1,416 for the year. Its tracker records 363 filings in June 2026, of which 97 defendants were “sued while using a 3rd party accessibility related control (widget)” and 93 had a previous ADA digital lawsuit.
On repeat defendants, cite the count and its denominator rather than either published percentage. The year-end report says “1,427 ADA digital accessibility lawsuits targeted companies that had already been sued, accounting for 45% of all federal cases,” and 1,427 of that report’s own 3,195 federal cases is 44.7 percent. A UsableNet blog post gives the same fact as 46 percent of federal cases. The reconcilable statement is 1,427 of 3,195.
None of this tells you whether a given product satisfies a conformance claim, which is a separate question with a separate evidence standard: see what an overlay can and cannot support in a conformance claim.
2026 to date: one quarter, one projection
No publisher has a full-year 2026 count, so every 2026 figure has to be labeled as a partial period or a projection.
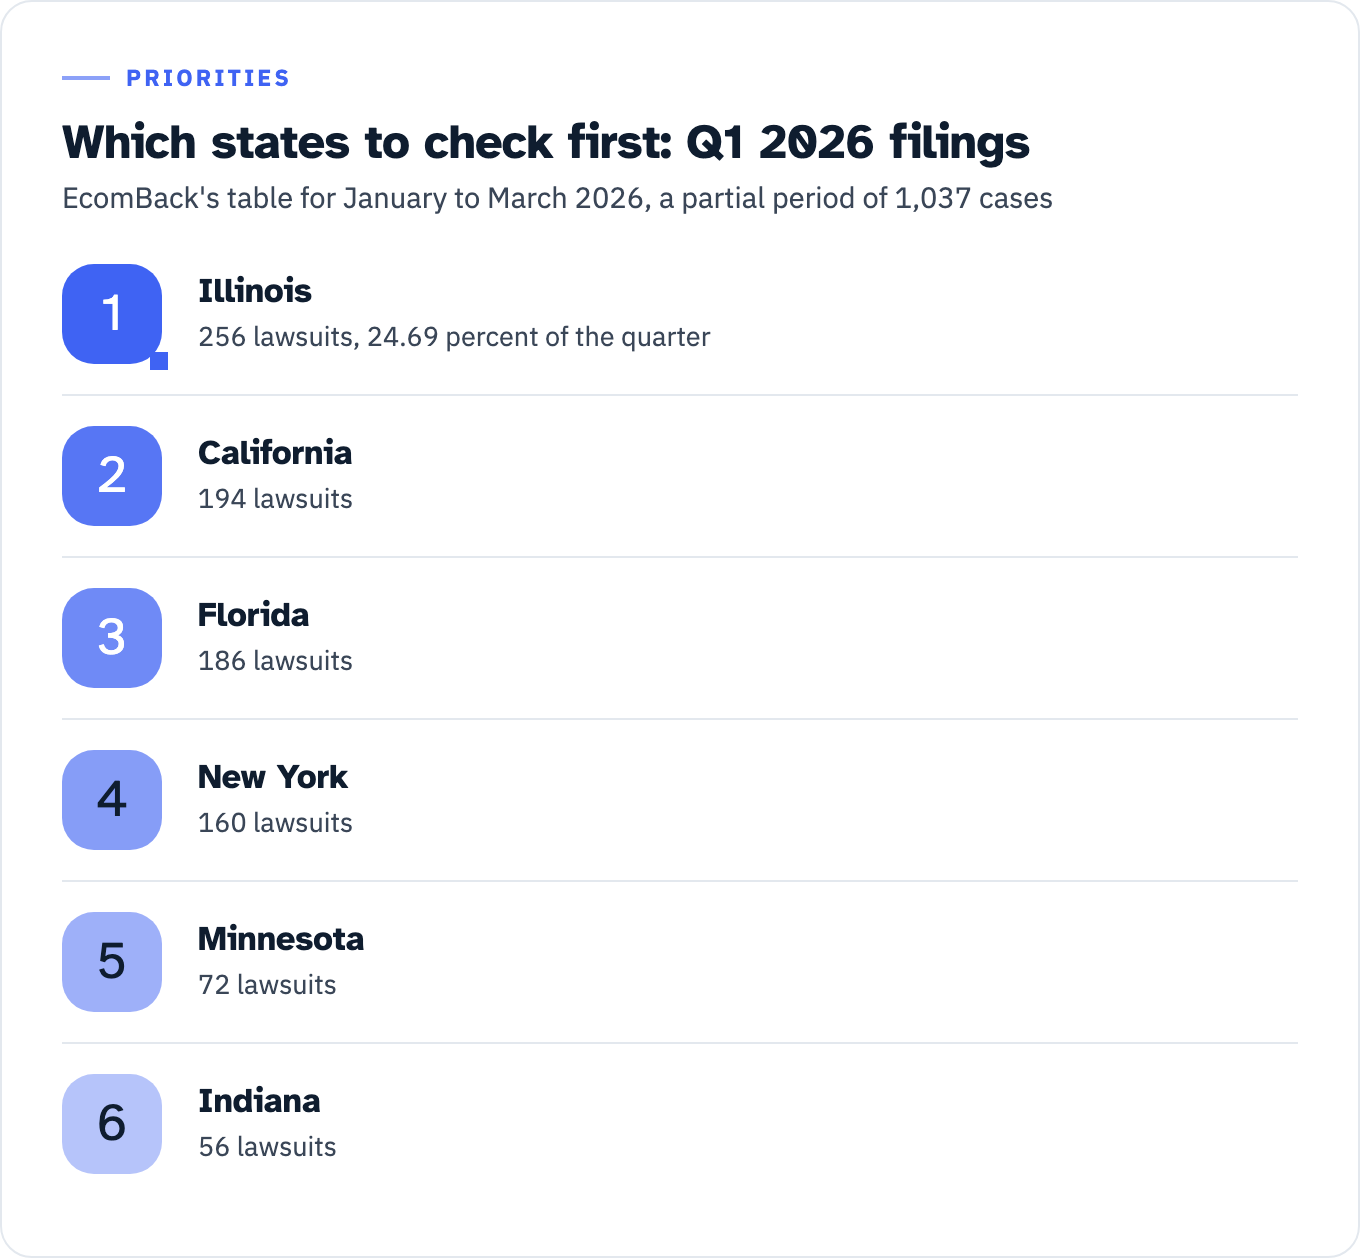
EcomBack’s Q1 2026 recap reports 1,037 cases for January to March 2026, “a 5.49% increase from Q1 2025.” Its state table reorders the map: Illinois 256 (24.69 percent), California 194, Florida 186, New York 160, Minnesota 72, Indiana 56, Wisconsin 51, all other states 62. Quote the table and not the prose on that page, because the prose says “the remaining 97 lawsuits were filed across all other states” while the table says 62, and only the table reconciles to 1,037. That page also carries no methodology statement, so cite the annual report for method. Its concentration figures are the most useful thing on it: 162 plaintiffs filed in the quarter, the top 27 accounted for 524 cases (50.53 percent), and the top 10 firms for 856 (82.55 percent).
View the data as a list
- Illinois: 256 lawsuits, 24.69 percent of the quarter
- California: 194 lawsuits
- Florida: 186 lawsuits
- New York: 160 lawsuits
- Minnesota: 72 lawsuits
- Indiana: 56 lawsuits
UsableNet’s midyear blog post of 8 July 2026, by Jason Taylor, states that “at the current pace, website accessibility lawsuits are on track to surpass 6,000 in 2026, a historic high and a nearly 20% increase over 2025.” That is a projection from a partial year, and it should be labeled as one in any paper that repeats it. The underlying midyear report sits behind a registration form and is not cited here.
One figure from that post should not be used as evidence of movement. The sentence “in the first half of 2026, 36% of sued companies had annual revenue exceeding $25 million, up from 33% in 2024 and 27% in 2023” appears with identical comparators in the 2025 year-end report, where the same 36 percent is attributed to the first half of 2025. The same triple is published against two different periods.
Quarterly extracts also swing on which months they cover. Seyfarth’s monthly 2025 figures range from 219 in June to 319 in July. A three-month window can move the implied annual pace by a wide margin without anything changing in the world.
Check the number already in your memo
Five error patterns are live in pages that come up on this query. Each one is a quick check against your own draft.
- A state-inclusive count described as federal. A law firm analysis attributes 2,014 first-half-2025 lawsuits to EcomBack and describes them as “filed throughout many U.S. federal courts.” EcomBack’s own methodology names state court case search portals, and its California count of 787 cannot be federal when Seyfarth records four federal website filings there.
- A superseded compliance date. The same page still states that “the Department of Justice’s Title II rule takes effect in April 2026.” The operative dates are 26 April 2027 and 26 April 2028.
- A transcription slip in a headline statistic. A US Chamber business page says 3,225 web accessibility suits “were filed in federal court in 2022” where Seyfarth’s own series records 3,255.
- Publishers blended into one row. A vendor statistics page (not linked here, since it sells the product its numbers argue for) attributes a single “all courts” figure jointly to UsableNet and EcomBack, and pairs 8,667 with a 37 percent year-over-year jump where the publisher of that number reports a 2 percent fall. The same page prints an estimate of 35,000 to 50,000 demand letters sent in 2025 with no source attached. There is no verifiable published count of demand letters, so keep that point qualitative and rest it on Seyfarth’s own statement that demand letters are not in its numbers.
- Invented decimals in a reproduced table. Accessibility.build’s Accessibility Lawsuit Tracker 2026, updated 12 July 2026, reproduces the UsableNet industry table as 2.5 percent healthcare, 1.2 percent banking and finance, 0.8 percent education and 0.5 percent real estate, drops the Fitness & Wellness row, and gives the DOJ comment deadline as 19 June 2026 where the Federal Register sets 22 June 2026. UsableNet publishes whole numbers and an explicit less-than-one-percent band. A decimal in the reproduction is precision that no source carries.
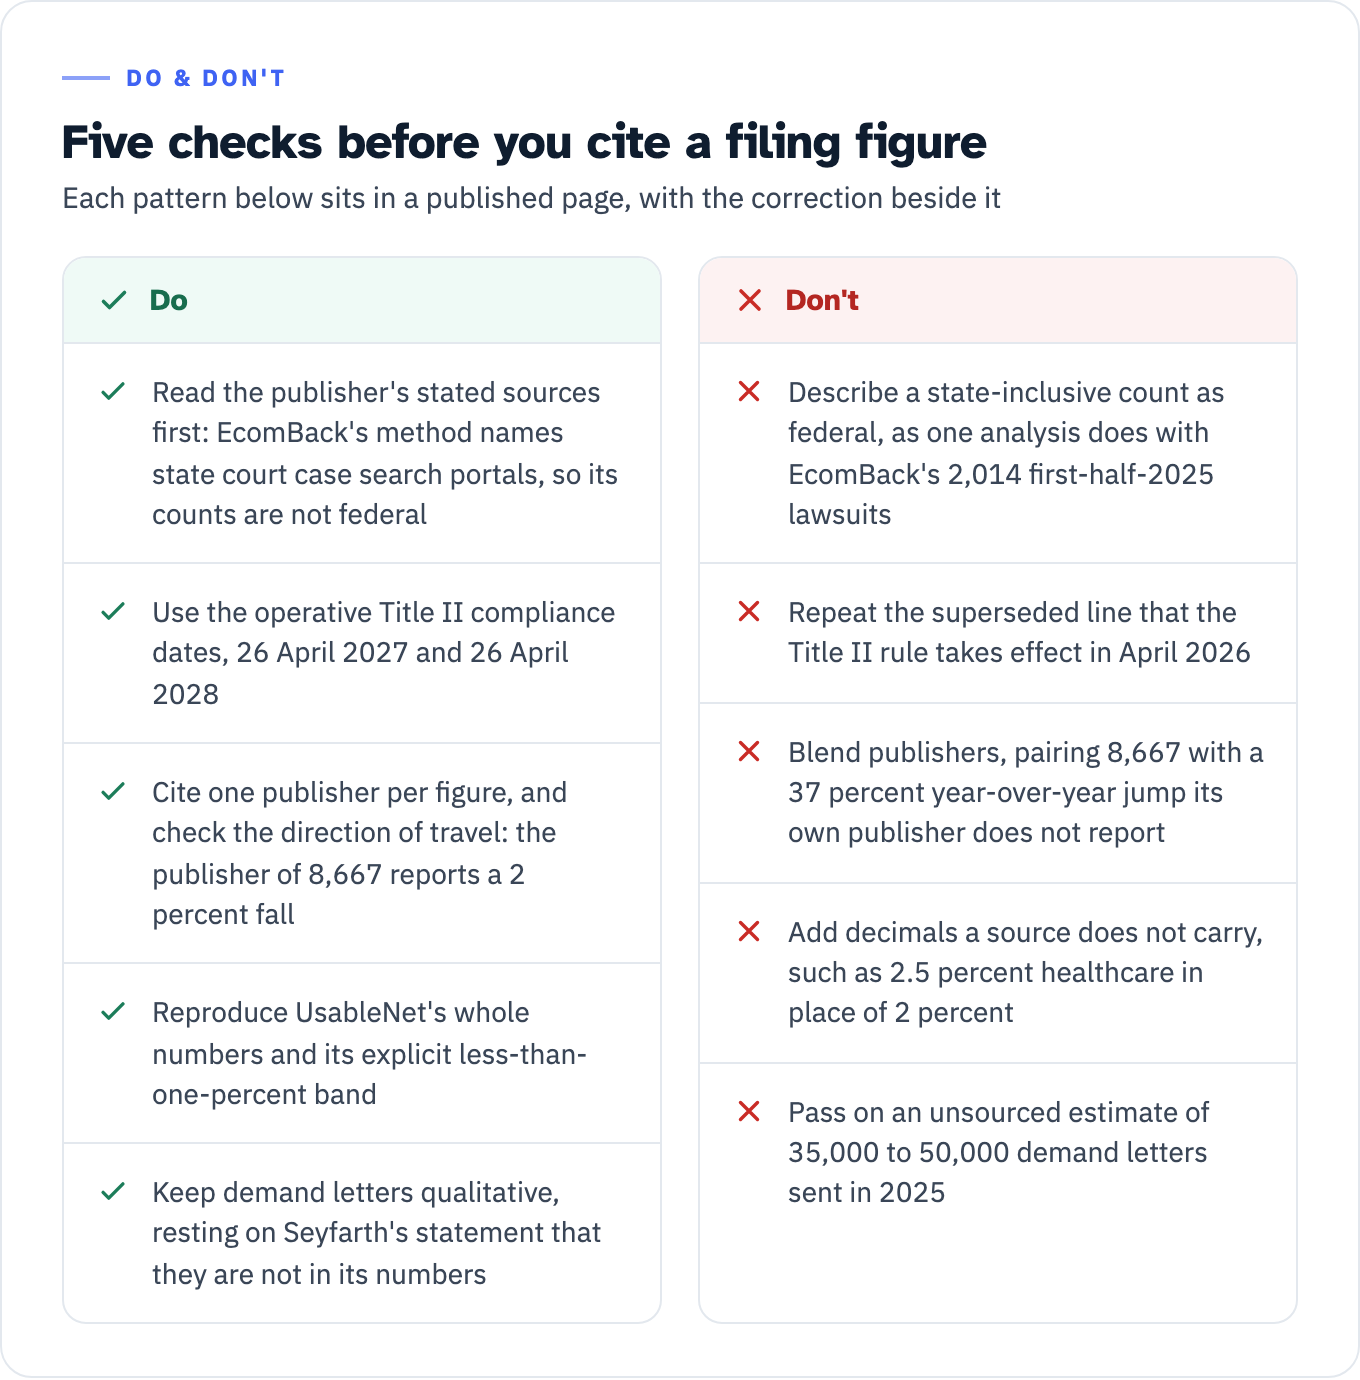
View the data as a table
| Do | Don’t |
|---|---|
| Read the publisher’s stated sources first: EcomBack’s method names state court case search portals, so its counts are not federal | Describe a state-inclusive count as federal, as one analysis does with EcomBack’s 2,014 first-half-2025 lawsuits |
| Use the operative Title II compliance dates, 26 April 2027 and 26 April 2028 | Repeat the superseded line that the Title II rule takes effect in April 2026 |
| Cite one publisher per figure, and check the direction of travel: the publisher of 8,667 reports a 2 percent fall | Blend publishers, pairing 8,667 with a 37 percent year-over-year jump its own publisher does not report |
| Reproduce UsableNet’s whole numbers and its explicit less-than-one-percent band | Add decimals a source does not carry, such as 2.5 percent healthcare in place of 2 percent |
| Keep demand letters qualitative, resting on Seyfarth’s statement that they are not in its numbers | Pass on an unsourced estimate of 35,000 to 50,000 demand letters sent in 2025 |
If your own draft has demand letters in it, one state has now legislated on them directly. Missouri’s Act Against Abusive Website or Web Content Access Litigation, section 537.1250 RSMo, takes effect on 28 August 2026 and applies to litigation pending on that date. Its safe harbor gives a defendant who receives written notice of an alleged access violation and “in good faith initiates substantial steps to correct it within ninety days” a rebuttable presumption that any subsequent claim is abusive litigation. Where a court finds abusive litigation, it may award the defending party attorney’s fees and costs, plus punitive damages or sanctions “not to exceed three times the amount of attorney’s fees awarded by the court.” Subsection 6 expires the section for registered entities and for the state and its political subdivisions if DOJ issues website accessibility standards under Title III. That is one statute in one state, on its own timetable: see what a cure notice does and does not protect you from.
The finding to carry away
The enforcement mechanism differs by sector. That is not the same statement as “the risk is lower,” and confusing the two is expensive in one specific direction. A university reading Education at 1 percent of UsableNet’s filings, or a city reading its own absence from every table, is looking at an instrument built to count private suits against commercial defendants: Seyfarth culls Title II defendants out of its parent Title III series by hand and says so, the other two publishers report no public-entity breakdown at all, and the 8,457 disability complaints that reached Education Department OCR in FY 2024 are outside every tracker on this page. Meanwhile the Title II and Section 504 duties are codified, dated, and under a challenge that asks a court to pull those dates a year earlier. A 1 percent share in a private filing dataset is not evidence that a covered entity can wait.
Next step
Take the reconciliation table above and mark the one row that matches your own footprint, using three facts about your organization: whether you have physical locations, whether any of your public-facing surface is a mobile app or video, and whether your activity sits in a state where filings have moved into state court, California being the clearest case at four federal filings against EcomBack’s 787. Write the resulting sentence with its publisher, artifact date, scope and exclusions, and put it in the paper in that form. If the row you marked is Title II, Section 504, education or government, add the compliance date from the last column to the same paper, because that date, not the filing count, is what your program has to be sized against.
If sizing the program is the next decision rather than sizing the number, an interface audit against WCAG 2.1 Level AA with a defect register you can schedule from is the artifact that turns a date into a plan: WCAG audits and testing.